Open Access
Fig. A.1
Download original image
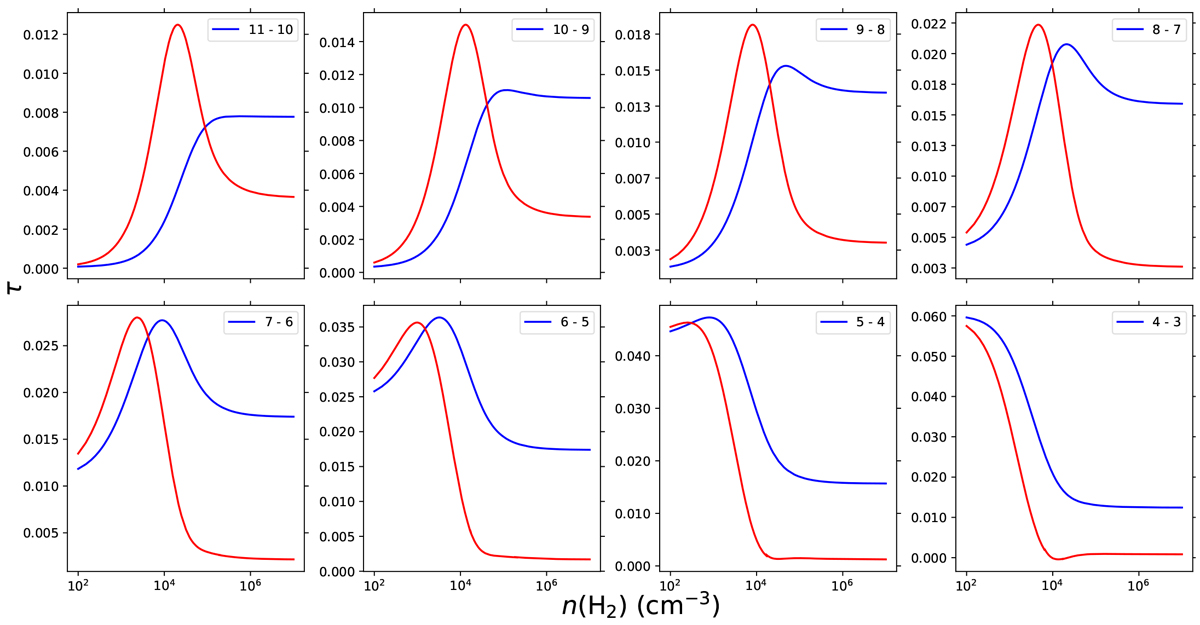
Dependence of the optical depth for the HC2NC observed emission lines on the gas density for selected temperatures. The blue and red lines stand for temperatures of 10 K and 40 K, respectively. The calculations were performed using a column density of 1012 cm−2.
Current usage metrics show cumulative count of Article Views (full-text article views including HTML views, PDF and ePub downloads, according to the available data) and Abstracts Views on Vision4Press platform.
Data correspond to usage on the plateform after 2015. The current usage metrics is available 48-96 hours after online publication and is updated daily on week days.
Initial download of the metrics may take a while.