Free Access
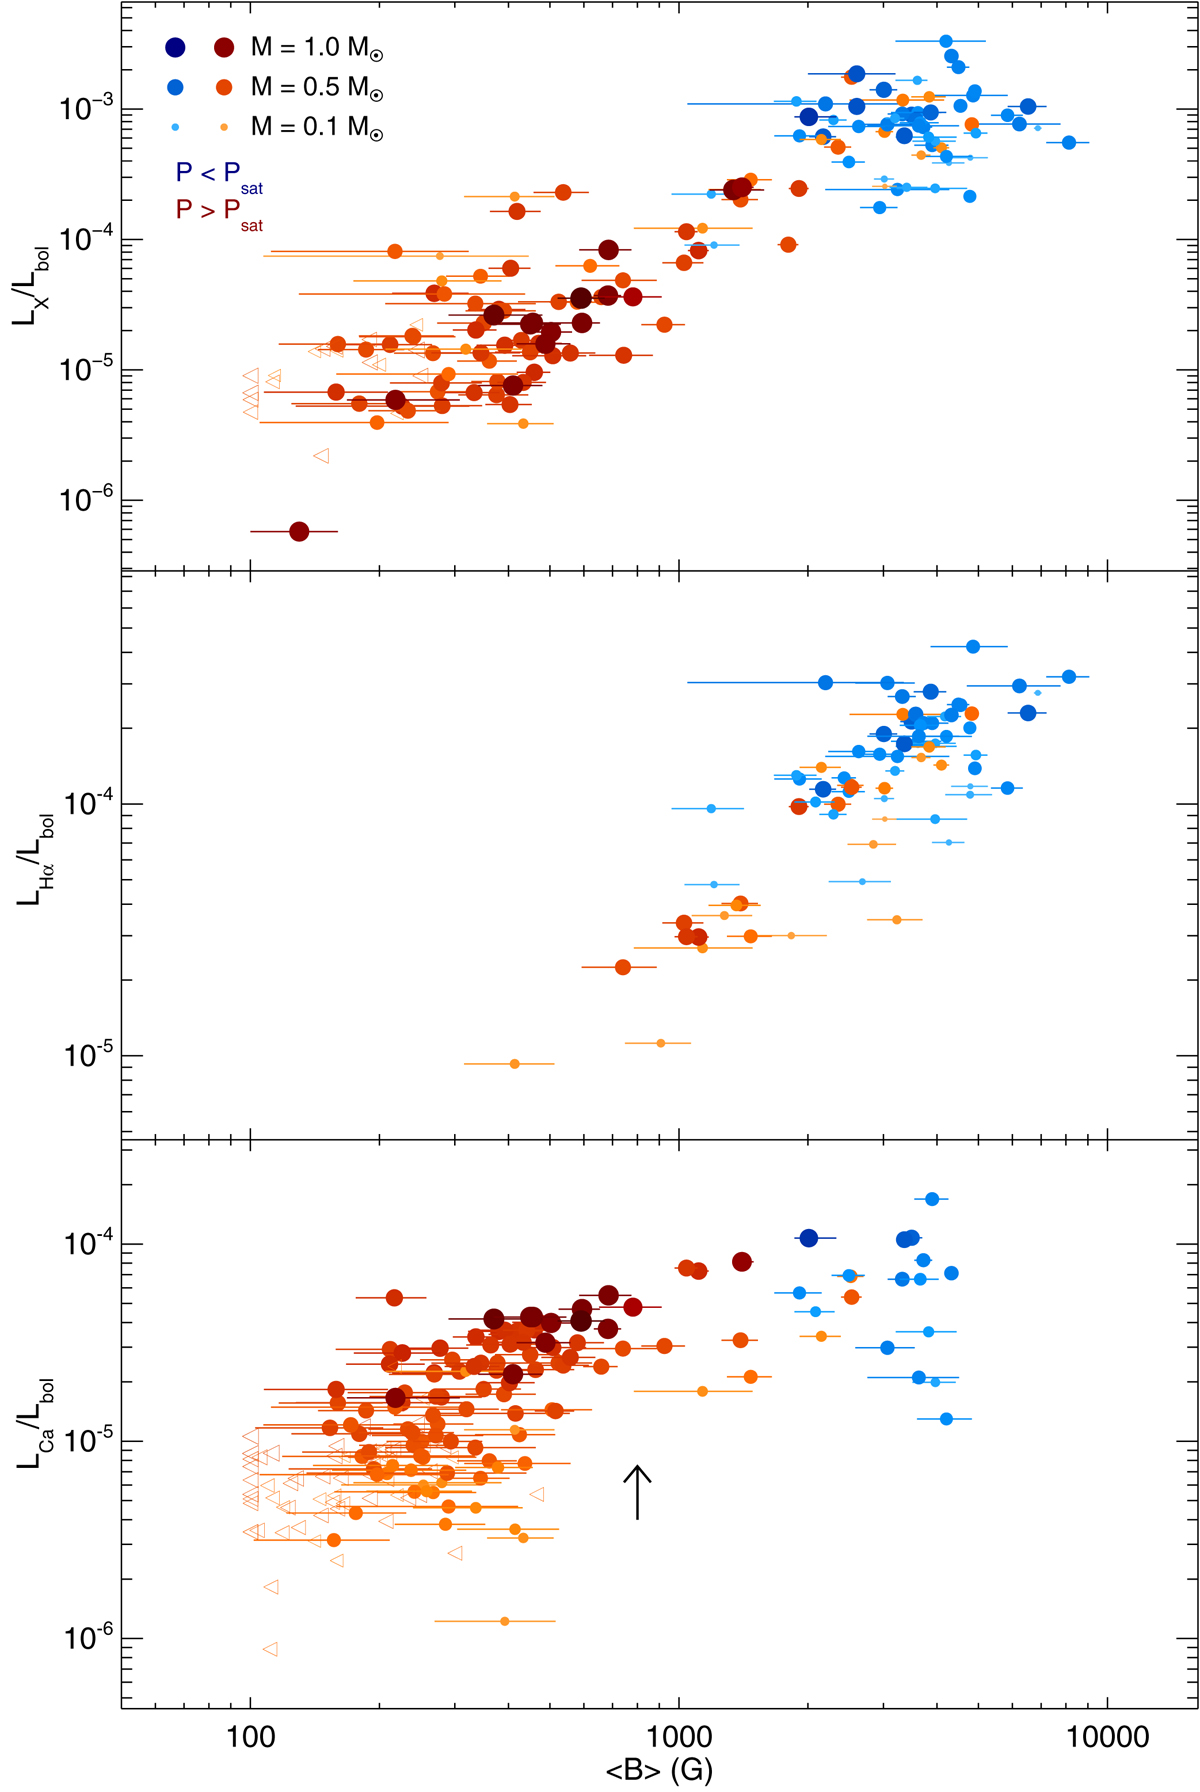
Fig. 8.
Download original image
Normalized coronal (X-ray, top panel) and chromospheric (Hα, middle panel; Ca H&K, bottom panel) emission as a function of average magnetic field. Symbol size and color are the same as in Fig. 5. The arrow in the bottom panel indicates the field strength at which the normalized Ca H&K emission saturates.
Current usage metrics show cumulative count of Article Views (full-text article views including HTML views, PDF and ePub downloads, according to the available data) and Abstracts Views on Vision4Press platform.
Data correspond to usage on the plateform after 2015. The current usage metrics is available 48-96 hours after online publication and is updated daily on week days.
Initial download of the metrics may take a while.