| Issue |
A&A
Volume 691, November 2024
|
|
|---|---|---|
| Article Number | L12 | |
| Number of page(s) | 5 | |
| Section | Letters to the Editor | |
| DOI | https://doi.org/10.1051/0004-6361/202452071 | |
| Published online | 08 November 2024 | |
Letter to the Editor
Probing the magnetic fields of starspots with transit mapping
Centro de Rádio Astronomia e Astrofísica Mackenzie (CRAAM), Universidade Presbiteriana Mackenzie, Rua da Consolação, 930, São Paulo, SP, 01302-907, Brazil
⋆ Corresponding author; menezes.astroph@gmail.com
Received:
30
August
2024
Accepted:
3
October
2024
Context. Starspots, regions of strong magnetic fields, serve as indicators of stellar activity and the dynamo mechanism at play in the interior of stars. The magnetic fields of main-sequence stars play a crucial role in driving stellar activity. An effective approach to better understanding stellar magnetic fields and activity lies in the detailed characterisation of starspot properties.
Aims. We propose a new method for estimating the magnetic fields of starspots that employs modelling techniques of planetary transit mapping, which provides estimates of the size, intensity, and location of spots on the stellar photosphere.
Methods. A starspot’s maximum magnetic field was calculated using the linear relationship with the spot flux deficit, ΔFspot (the spot’s brightness times its area) and the well-characterised relation for sunspots determined in this work, Bspot = 1170 + 844log ΔFspot (G).
Results. Applying this relationship to previously mapped spots on the photospheres of 14 FGK and M stars yields spot maximum magnetic fields ranging from 2700 G to 4600 G, with an overall average of 3900 ± 400 G. We looked for correlations between starspot magnetic fields and stellar properties. We did not find any correlation between a spot’s mean extreme magnetic field and effective temperature, nor the differential shear. However, a weak anti-correlation is seen between the spots’ magnetic field and stellar age as well as between the magnetic field and the rotation period.
Conclusions. When compared with previous results of small-scale magnetic field measurements, the B values obtained here are basically constant and near the saturation limit found for rapid rotators. This implies that it is not the intensity of the magnetic field of starspots that decreases with age but rather the filling factor. This result offers a unique window into the magnetic dynamo of stars.
Key words: stars: activity / stars: magnetic field / stars: rotation / stars: solar-type / starspots
© The Authors 2024
 Open Access article, published by EDP Sciences, under the terms of the Creative Commons Attribution License (https://creativecommons.org/licenses/by/4.0), which permits unrestricted use, distribution, and reproduction in any medium, provided the original work is properly cited.
This article is published in open access under the Subscribe to Open model. Subscribe to A&A to support open access publication.
1. Introduction
The Sun and other low-mass main-sequence stars have magnetic fields that influence their evolution (Reiners 2012; Brun & Browning 2017) and affect the atmospheres and habitability of orbiting planets. These fields are generated in the convective zone by a dynamo mechanism (Parker 1955; Spruit 1997; Spruit et al. 2010; Charbonneau 2014; Stejko et al. 2020). For stars that are not fully convective, these magnetic flux tubes, forming in the tachocline, float towards the photosphere, eventually emerging as concentrated magnetic areas, such as spots and faculae.
Starspots, akin to sunspots, are dark areas on the surface of stars distributed throughout different longitudes and latitudes, which change with the magnetic cycle (e.g. Estrela & Valio 2016). Spot activity is also observed on main-sequence late-type stars and can be an indicator of stellar magnetic activity and topology (Hathaway 2015; Menezes et al. 2023). Starspots inhibit convective energy transport from the interior to the surface (Lammer & Khodachenko 2015; Covas 2017), providing insights into the stellar magnetic dynamo.
High-precision photometry from space missions, such as the pioneering CoRoT (Convection, Rotation and planetary Transits; Baglin et al. 2006; Auvergne et al. 2009), Kepler (Borucki et al. 2010), and the Transiting Exoplanet Survey Satellite (TESS; Ricker et al. 2015), has enabled systematic studies of stellar rotation, flares, and starspots, enhancing our understanding of stellar activity. Long-term monitoring of starspots on different stars provides valuable data for modelling the complex interplay between magnetic fields, stellar age, and starspot formation. In particular, space mission data help us understand whether solar phenomena, such as sunspots, are common among solar-type stars.
Though substantial advancements in observational tools and techniques for studying starspots have been made over the last two decades (Berdyugina 2005; Brun & Browning 2017), research on magnetic activity, particularly related to starspots, remains limited due to the lack of technology for creating stellar magnetograms. Two complementary techniques are primarily employed to characterise stellar magnetic fields. Zeeman-Doppler imaging (ZDI; e.g. Morin et al. 2013) reveals the geometry of the large-scale magnetic field, while Zeeman broadening (ZB) measures the total unsigned magnetic flux, including contributions from small-scale structures like spots.
However, the use of ZB is limited to slowly rotating stars (vsin(i)≤20 km s−1; Vidotto et al. 2014a). Furthermore, ZDI is best suited for rapidly rotating stars (more than a few tens of km s−1), and there are significant challenges when using it to analyse slowly rotating stars with periods of ≳5 days. Even though Lehmann et al. (2024) successfully performed ZDI mapping on stars with periods of ≥40 days, this can result in a significant loss of magnetic geometry resolution. Moreover, ZDI measures the longitudinal, or global, magnetic fields of stars, which are about ten times weaker than those of small-scale fields (Hahlin et al. 2023). Thus, despite the large number of ZDI measurements reported in the literature (Strassmeier 2009; Mengel et al. 2017; Bellotti et al. 2024), they are not considered here.
On the other hand, measurements of magnetic fields based on the ZB of spectral lines come closer to the magnitudes of spots’ B fields. Many studies have measured the small-scale magnetic fields of M dwarfs (Reiners et al. 2022; Afram & Berdyugina 2019; Donati et al. 2023; Cristofari et al. 2023; Han et al. 2023; Shulyak et al. 2019; Wanderley et al. 2024a), which range from roughly 1 to 7 kG. Moreover, the magnetic field intensity has been seen to decrease with the rotation period or Rossby number for stars with Ro ≳ 0.1. However, a saturation regime emerged for rapid rotators, whose magnetic fields, despite the rotation period, remained practically constant (Reiners et al. 2022).
There are also reports of small-scale magnetic fields for solar-like stars based on ZB (Hahlin et al. 2023; Moutou et al. 2017; See et al. 2019) and Zeeman intensification (ZI; Kochukhov et al. 2020), which originates from the same physics as ZB, except the ZI signal is less sensitive to rotation (e.g. LQ Hya has a projected rotation velocity closer to 30 km s−1; Kochukhov et al. 2020). Nevertheless, these measurements are entangled with the filling factors of magnetic regions on the stellar surface (Kochukhov et al. 2020). Thus, new approaches to investigating the magnetic activity of starspots in stars with longer rotation periods are necessary.
Here, for the first time, we propose the use of spot transit mapping to estimate the magnetic fields of starspots. We studied 14 late-type stars observed by the Kepler and CoRoT space missions. This method, which is limited to stars with transiting planets, focuses on the starspots’ average magnetic field as they are probed during transits, the key advantage being its insensitivity to stellar rotation. Unlike the ZDI technique, which primarily probes the large-scale geometry of stellar magnetic fields, our method allows us to obtain magnetic properties that are more challenging to derive from disk-integrated spectra, which often average out the contributions from various magnetic structures. Moreover, this new approach is not subject to the uncertainty of the filling factor since the filling factor is the magnetic field estimate of the starspot itself.
The spot transit mapping method has been used to characterise the physical properties of starspots, such as the radius, intensity (or temperature), and their position (latitude and longitude). It also allows one to estimate stellar differential rotation (Valio et al. 2017; Zaleski et al. 2020; Araújo & Valio 2021; Zaleski et al. 2022), activity cycles (Estrela & Valio 2016), and obliquity (Valio & Araújo 2022).
To estimate starspot magnetic fields, we assumed that the relationship between magnetic fields and spot characteristics on other stars is analogous to that observed in sunspots. This relation was obtained from the study of more than 32 000 sunspots by Valio et al. (2020), who find correlations between extreme magnetic fields and spot properties such as area, intensity, and temperature.
In Sect. 2 the relation between the magnetic field of sunspots and their physical properties is described. Estimates of the magnetic field of starspots for previously observed stars are detailed in Sect. 3. Finally, we summarise and discuss our key findings and present our conclusions in Sect. 4.
2. Sunspot magnetic fields
In Valio et al. (2020), the physical characteristics of sunspots, such as area, intensity (or temperature), and magnetic field magnitude, were extracted from visible light images and magnetograms from the Michelson Doppler Imager (MDI) on board the Solar and Heliospheric Observatory (SOHO; Domingo et al. 1995; Scherrer et al. 1995). Valio et al. (2020), using computer vision techniques, automatically selected spots with longitudes between −40° and +40° over Solar Cycle 23, from which the area, intensity, and extreme magnetic field were collected. This selection resulted in a total of 32 223 sunspots from Solar Cycle 23, from May 1996 through April 2008.
The average temperature of sunspots was obtained from their intensity using Eq. (3) of Valio et al. (2020), assuming that both the surrounding photosphere and the sunspot emit as a black body. The authors find linear correlations between the logarithm of the area and the intensity, as well as a quadratic relationship between the magnetic field and temperature.
In Menezes et al. (2020, 2023), the relationship between the extreme magnetic field and the intensity of sunspots was simplified to a single equation that takes all sunspots into consideration,

where Bspot is the absolute value of the sunspot magnetic field (in G), and Ispot is the spot intensity relative to the mean intensity of the centre of the solar disk, I⋆ = 1. However, the magnetic field of a sunspot is also related to its area:

where Aspot is the spot area, in millionths of a solar hemisphere (mh).
Our goal here is to estimate the magnetic field of starspots using these equations and the properties of a starspot’s area and intensity. However, there is a known degeneracy between a starspot’s area and the intensity obtained from transit mapping, since both are calculated from small brightness variations detected in the transit light curve.
Hence, it is better to use the spot flux deficit, which is a combination of a spot’s area and intensity and is related to the stellar brightness variation. The spot flux deficit is defined as

Using sunspot data, we estimated the flux deficit based on the area and intensity measured by Valio et al. (2020). In Fig. 1, the extreme magnetic field of sunspots is plotted against its flux deficit. A linear fit to the data, shown as a red line, is given by

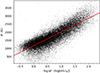 |
Fig. 1. Sunspot absolute maximum flux, Bspot, as a function of its flux deficit, log ΔFspot. The red line represents the linear fit given by Eq. (4). |
We note that the maximum magnetic field strength that can be found using Eq. (4) is about 6 kG when considering log ΔFspot = 6. This is probably due to the fact that we studied sunspots whose maximum magnetic field strength was 4 kG for the period analysed (see Fig. 1).
It is noteworthy that relying solely on solar data can introduce biases when examining stars of significantly different spectral types or activity levels compared to the Sun. However, due to the scarcity of observational data for other spectral types, it is still not possible to conclusively verify this impact. Baliunas et al. (1995) noted that stellar activity varies with age and rotation, showing that younger stars often exhibit relatively unpredictable variations and older stars more regular activity cycles. This implies the need for caution when extrapolating solar data to stars outside the solar spectrum or with higher activity levels.
3. Magnetic fields of stellar spots
For our analysis, we used spots previously mapped on the photosphere of 14 FGK and M stars. The stellar parameters, such as spectral type, age, and mean rotation period, are listed in Table 1.
Stellar and planetary parameters.
Starspots were mapped using a technique called spot transit mapping, first proposed by Silva (2003). This method involves identifying features on the surface of stars by analysing planetary transits. As a planet eclipses its host star, it can occult dark spots, causing detectable variations in the transit light curve. By analysing these variations, one can infer the physical properties of the spots, such as their size, intensity (or temperature), and position. Silva (2003) developed the ECLIPSE1 model, in which a 2D pixelated image of a limb-darkened star is used to simulate planetary transits, while the exoplanet is modelled as a dark disk at various positions along its computed orbit. Additionally, dark spots and/or bright faculae can be added to the 2D stellar surface; however, our estimation of the magnetic field only considers dark spots, as Valio et al. (2020) only used sunspot data.
This model has since been improved and applied to over a dozen FGK and M stars (Silva-Valio et al. 2010; Valio et al. 2017, 2024; Zaleski et al. 2019, 2020, 2022; Netto & Valio 2020; Araújo & Valio 2021; Valio & Araújo 2022). The mean properties of the spots, such as intensity and area, are estimated from transit mapping for each star and are listed in the right columns of Table 1 along with the total number of spots detected on each star.
To estimate the absolute maximum magnetic field of the spots on these stars, first the flux deficit has to be calculated from their mean area and intensity. The flux deficits of 2269 starspots of the previously mapped 14 FGK and M main-sequence stars were calculated using Eq. (3) and are listed in the seventh column of Table 1. Next, the mean maximum magnetic field of starspots was determined using Eq. (4). The results are listed in the eighth column of Table 1.
In Fig. 2, the relations between starspot magnetic field and intensity (left panel) and between the magnetic field and area (right panel) are shown for all the stars. As can be seen from the figure, Bspot is inversely proportional to Ispot and directly proportional to log Aspot, that is, darker and larger spots exhibit stronger B fields, similar to what is noted in the solar counterparts (Valio et al. 2020).
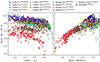 |
Fig. 2. Spot magnetic field, Bspot, as a function of spot intensity, Ispot (left panel), and area, log Aspot (right panel). |
We also searched for correlations between the mean of the spot maximum B field,  , of each star and stellar parameters such as age, effective temperature (Teff), rotation period (Prot), and differential rotation (rotational shear, ΔΩ), which are shown in Fig. 3. Although no correlation is found between the magnetic field and Teff (top-right panel) or ΔΩ (bottom-right panel), weak anti-correlations between
  and age and between
  and Prot are found. These correlations were expected since the magnetic field is produced by a dynamo mechanism that decreases with the rotation and age of the star (Skumanich 1972). Noteworthy is the fact that young stars, with ages of ≤0.5 Gyr, seem to have spots with weaker magnetic fields than stars older than 0.5 Gyr.
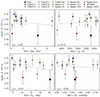 |
Fig. 3. Average magnetic field of spots, Bspot, as a function of stellar age (top left), effective temperature (top right), rotation period (bottom left), and differential rotation shear (bottom right). Colours and symbols have the same meanings as in Fig. 2. Stellar parameters were obtained from the references listed in Table 1. |
4. Discussion and conclusions
We have proposed a novel way to estimate the magnetic fields of starspots, assuming that magnetic field follows the relation between the maximum magnetic field of a sunspot and its flux deficit given by Eq. (4). The spot’s flux deficit, defined by Eq. (3), is a combination of the spot area and intensity (or temperature), which is a measure of how much flux of the Sun or star is subtracted due to the presence of dark spots on its surface.
Assuming that this same relation can be applied to other stars, we used the starspot radius (or area) and intensity, estimated via the transit mapping technique in previous works, to calculate the average spot extreme magnetic field of 14 FGK and M stars. We find that, following Eq. (4), the spot magnetic field increases with the area of the spot and decreases with the spots’ intensity, or temperature, as in the solar case. We note that the minimum magnetic field strength of starspots measured in this study is around 2 kG, whereas sunspots can reach a few hundred gauss. This discrepancy may bias the estimated B spot towards higher values when compared to solar values, potentially explaining why the solar value (black circle) falls below the trend in Fig. 3.
Correlations between the mean spot extreme magnetic field and the stellar properties were sought. However, no clear dependence of the spot’s magnetic field on stellar spectral type, or its effective temperature, Teff, is detected (top-right panel of Fig. 3). Nor is there any correlation between the spot’s magnetic field and the stellar magnetic shear (bottom-right panel of Fig. 3). This observed lack of correlation between a spot’s magnetic field and these stellar parameters could be attributed to potential magnetic interactions between the stars and their close-in transiting planets. This topic will be investigated further in the future.
On the other hand, a weak anti-correlation is found between the mean Bspot and stellar age as well as between the mean Bspot and the mean rotation period (left panels of Fig. 3). This behaviour was expected due to the decrease in dynamo action as a star ages and due to the loss of angular momentum as its rotation period increases. However, we do not detect the usually seen saturation behaviour of rapid rotators followed by a sharp decrease in the spots’ magnetic field with rotation period, as observed in previous works that studied (mainly) M dwarfs (Vidotto et al. 2014b; Shulyak et al. 2019; See et al. 2019; Reiners et al. 2022; Cristofari et al. 2023; Wanderley et al. 2024a).
For comparison, in Fig. 4 we plot the measurements of small-scale magnetic fields from See et al. (2019) of 21 low-mass FGK and M stars (blue triangles) and those of Kochukhov et al. (2020) for 15 Sun-like stars (green squares). Furthermore, Kochukhov et al. (2020) modelled the measured average magnetic field, ⟨B⟩ (open squares), to infer the filling factor and the magnetic field, B (filled squares), of active regions. Our results for the magnetic fields inferred from the spot transit mapping are shown as red circles in Fig. 4. As can be seen, both the results of See et al. (2019) and the mean magnetic fields of Kochukhov et al. (2020) display the decrease in B with rotation period for Prot > 2 − 5 days. On the other hand, the magnetic fields of starspots analysed here seem to remain on the saturation plateau, agreeing with the field of magnetic regions estimated by Kochukhov et al. (2020) (filled green squares). Furthermore, the magnetic field values do not differ much from B ∼ 3300 ± 700 G, which includes the mean solar value of ∼2700 G (black circle in Figure 4).
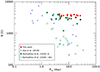 |
Fig. 4. Magnetic field measurements and estimates as a function of the stellar rotation period. Our results are displayed as red circles, the FGK and M stars observed by See et al. (2019) as blue triangles, the mean magnetic field of GK stars from Kochukhov et al. (2020) as open green squares, and the inferred field of magnetic regions as filled squares. The black circle represents the solar value. |
From these results, we can conclude that the magnetic field strength in strong magnetic regions, such as starspots, typically ranges between 3 and 4 kG, similar to the saturation value observed in fast rotators. In the saturated regime, the filling factor is believed to be close to 1 (Reiners et al. 2009), meaning that the star’s surface is almost entirely covered by spots. Furthermore, this magnetic field strength appears to be largely independent of the stellar rotation period (or age) and effective temperature (or stellar mass). This suggests that the underlying dynamo mechanism responsible for generating magnetic active regions on stellar surfaces may have intrinsic properties that are consistent across different types of stars. Moreover, the value of the maximum magnetic field of spots remains basically constant throughout stellar evolution and across spectral type, and the decrease in the mean magnetic field observed by previous authors is really due to a decrease in the filling factor (or area coverage) of spots as the star ages.
Furthermore, we searched for magnetic field measurements of the 14 stars analysed here. To our knowledge, the M dwarf Kepler-45 is the only star with small-scale measurements, which were undertaken with the Apache Point Observatory Galactic Evolution Experiment (APOGEE) survey. Wanderley et al. (2024b) report a value of B = 580 ± 150 G for Kepler-45, almost seven times lower than the maximum magnetic field of 3900 ± 260 G we estimated from spot transit mapping. This discrepancy implies a filling factor of about 15%, assuming ⟨B⟩=f ⋅ B.
In conclusion, understanding starspots and their relationship to stellar magnetic fields is essential for advancing our knowledge of stellar dynamos. Furthermore, studying starspots across various stellar spectral types and ages enhances our comprehension of magnetic dynamo processes and the effects of stellar activity on orbiting planets.
Acknowledgments
We are grateful for the anonymous referee for his/her thorough review and constructive comments, which have greatly contributed to improving the quality and clarity of this Letter. This Letter includes data collected by the Kepler mission and retrieved from the Barbara A. Mikulski Archive for Space Telescopes (MAST) data archive at the Space Telescope Science Institute (STScI). Funding for the Kepler mission is provided by the NASA Science Mission Directorate. STScI is operated by the Association of Universities for Research in Astronomy, Inc., under NASA contract NAS 5–26555. The authors are grateful to everyone involved in the planning and operation of the CoRoT satellite which made these observations possible. F.M. acknowledges financial support from grant #2022/12024-0, whereas A.V. was partially funded from grants #2021/02120-0 and #2018/04055-8 of the São Paulo Research Foundation (FAPESP). A.A. acknowledges financial support from the Conselho Nacional de Desenvolvimento Científico e Tecnológico (CNPq; #150817/2022-3 and #172886/2023-6).
References
- Afram, N., & Berdyugina, S. V. 2019, A&A, 629, A83 [NASA ADS] [CrossRef] [EDP Sciences] [Google Scholar]
- Araújo, A., & Valio, A. 2021, ApJ, 907, L5 [CrossRef] [Google Scholar]
- Auvergne, M., Bodin, P., Boisnard, L., et al. 2009, A&A, 506, 411 [NASA ADS] [CrossRef] [EDP Sciences] [Google Scholar]
- Baglin, A., Auvergne, M., Barge, P., et al. 2006, ESA Monogr., SP-1306, 33 [Google Scholar]
- Baliunas, S. L., Donahue, R. A., Soon, W. H., et al. 1995, ApJ, 438, 269 [Google Scholar]
- Bellotti, S., Evensberget, D., Vidotto, A. A., et al. 2024, A&A, 688, A63 [NASA ADS] [CrossRef] [EDP Sciences] [Google Scholar]
- Berdyugina, S. V. 2005, Liv. Rev. Sol. Phys., 2, 8 [Google Scholar]
- Bonomo, A. S., Desidera, S., Benatti, S., et al. 2017, A&A, 602, A107 [NASA ADS] [CrossRef] [EDP Sciences] [Google Scholar]
- Borucki, W. J., Koch, D., Basri, G., et al. 2010, Science, 327, 977 [Google Scholar]
- Brun, A. S., & Browning, M. K. 2017, Liv. Rev. Sol. Phys., 14, 4 [Google Scholar]
- Charbonneau, P. 2014, ARA&A, 52, 251 [NASA ADS] [CrossRef] [Google Scholar]
- Covas, E. 2017, A&A, 605, A44 [NASA ADS] [CrossRef] [EDP Sciences] [Google Scholar]
- Cristofari, P. I., Donati, J. F., Moutou, C., et al. 2023, MNRAS, 526, 5648 [NASA ADS] [CrossRef] [Google Scholar]
- Domingo, V., Fleck, B., & Poland, A. I. 1995, Sol. Phys., 162, 1 [Google Scholar]
- Donati, J. F., Lehmann, L. T., Cristofari, P. I., et al. 2023, MNRAS, 525, 2015 [CrossRef] [Google Scholar]
- Estrela, R., & Valio, A. 2016, ApJ, 831, 57 [NASA ADS] [CrossRef] [Google Scholar]
- Hahlin, A., Kochukhov, O., Rains, A. D., et al. 2023, A&A, 675, A91 [NASA ADS] [CrossRef] [EDP Sciences] [Google Scholar]
- Han, E., López-Valdivia, R., Mace, G. N., & Jaffe, D. T. 2023, AJ, 166, 4 [NASA ADS] [CrossRef] [Google Scholar]
- Hathaway, D. H. 2015, Liv. Rev. Sol. Phys., 12, 4 [Google Scholar]
- Kochukhov, O., Hackman, T., Lehtinen, J. J., & Wehrhahn, A. 2020, A&A, 635, A142 [NASA ADS] [CrossRef] [EDP Sciences] [Google Scholar]
- Lammer, H., & Khodachenko, M. 2015, Astrophys. Space Sci. Lib., 411, 253 [NASA ADS] [CrossRef] [Google Scholar]
- Lehmann, L. T., Donati, J. F., Fouqué, P., et al. 2024, MNRAS, 527, 4330 [Google Scholar]
- Menezes, F., Netto, Y., Kay, C., Opher, M., & Valio, A. 2020, IAU Symp., 354, 421 [NASA ADS] [Google Scholar]
- Menezes, F., Valio, A., Netto, Y., et al. 2023, MNRAS, 522, 4392 [NASA ADS] [CrossRef] [Google Scholar]
- Mengel, M. W., Marsden, S. C., Carter, B. D., et al. 2017, MNRAS, 465, 2734 [CrossRef] [Google Scholar]
- Morin, J., Jardine, M., Reiners, A., et al. 2013, Astron. Nachr., 334, 48 [NASA ADS] [CrossRef] [Google Scholar]
- Morton, T. D., Bryson, S. T., Coughlin, J. L., et al. 2016, ApJ, 822, 86 [Google Scholar]
- Moutou, C., Hébrard, E. M., Morin, J., et al. 2017, MNRAS, 472, 4563 [NASA ADS] [CrossRef] [Google Scholar]
- Netto, Y., & Valio, A. 2020, A&A, 635, A78 [NASA ADS] [CrossRef] [EDP Sciences] [Google Scholar]
- Parker, E. N. 1955, ApJ, 122, 293 [Google Scholar]
- Raetz, S., Heras, A. M., Fernández, M., Casanova, V., & Marka, C. 2019, MNRAS, 483, 824 [NASA ADS] [CrossRef] [Google Scholar]
- Reiners, A. 2012, Liv. Rev. Sol. Phys., 9, 1 [Google Scholar]
- Reiners, A., Basri, G., & Browning, M. 2009, ApJ, 692, 538 [NASA ADS] [CrossRef] [Google Scholar]
- Reiners, A., Shulyak, D., Käpylä, P. J., et al. 2022, A&A, 662, A41 [NASA ADS] [CrossRef] [EDP Sciences] [Google Scholar]
- Ricker, G. R., Winn, J. N., Vanderspek, R., et al. 2015, J. Astron. Telesc. Instrum. Syst., 1, 014003 [Google Scholar]
- Sanchis-Ojeda, R., Winn, J. N., Marcy, G. W., et al. 2013, ApJ, 775, 54 [Google Scholar]
- Scherrer, P. H., Bogart, R. S., Bush, R. I., et al. 1995, Sol. Phys., 162, 129 [Google Scholar]
- See, V., Matt, S. P., Folsom, C. P., et al. 2019, ApJ, 876, 118 [Google Scholar]
- Shulyak, D., Reiners, A., Nagel, E., et al. 2019, A&A, 626, A86 [NASA ADS] [CrossRef] [EDP Sciences] [Google Scholar]
- Silva, A. V. R. 2003, ApJ, 585, L147 [Google Scholar]
- Silva-Valio, A., Lanza, A. F., Alonso, R., & Barge, P. 2010, A&A, 510, A25 [NASA ADS] [CrossRef] [EDP Sciences] [Google Scholar]
- Skumanich, A. 1972, ApJ, 171, 565 [Google Scholar]
- Southworth, J. 2011, MNRAS, 417, 2166 [Google Scholar]
- Spruit, H. 1997, Mem. Soc. Astron. It., 68, 397 [Google Scholar]
- Spruit, H. C., Scharmer, G. B., & Löfdahl, M. G. 2010, A&A, 521, A72 [NASA ADS] [CrossRef] [EDP Sciences] [Google Scholar]
- Stejko, A. M., Guerrero, G., Kosovichev, A. E. G., & Smolarkiewicz, P. K. 2020, ApJ, 888, 16 [NASA ADS] [CrossRef] [Google Scholar]
- Strassmeier, K. G. 2009, A&ARv, 17, 251 [Google Scholar]
- Sun, L., Ioannidis, P., Gu, S., et al. 2019, A&A, 624, A15 [NASA ADS] [CrossRef] [EDP Sciences] [Google Scholar]
- Valio, A., & Araújo, A. 2022, ApJ, 940, 132 [NASA ADS] [CrossRef] [Google Scholar]
- Valio, A., Estrela, R., Netto, Y., Bravo, J. P., & de Medeiros, J. R. 2017, ApJ, 835, 294 [CrossRef] [Google Scholar]
- Valio, A., Spagiari, E., Marengoni, M., & Selhorst, C. L. 2020, Sol. Phys., 295, 120 [NASA ADS] [CrossRef] [Google Scholar]
- Valio, A., Araújo, A., & Menezes, F. 2024, ApJ, 972, 81 [NASA ADS] [CrossRef] [Google Scholar]
- Vidotto, A. A., Gregory, S. G., Jardine, M., et al. 2014a, MNRAS, 441, 2361 [Google Scholar]
- Vidotto, A. A., Jardine, M., Morin, J., et al. 2014b, MNRAS, 438, 1162 [Google Scholar]
- Wanderley, F., Cunha, K., Kochukhov, O., et al. 2024a, ApJ, 971, 112 [NASA ADS] [CrossRef] [Google Scholar]
- Wanderley, F., Cunha, K., Souto, D., & Smith, V. V. 2024b, ApJ, submitted [Google Scholar]
- Zaleski, S. M., Valio, A., Marsden, S. C., & Carter, B. D. 2019, MNRAS, 484, 618 [NASA ADS] [CrossRef] [Google Scholar]
- Zaleski, S. M., Valio, A., Carter, B. D., & Marsden, S. C. 2020, MNRAS, 492, 5141 [NASA ADS] [CrossRef] [Google Scholar]
- Zaleski, S. M., Valio, A., Carter, B. D., & Marsden, S. C. 2022, MNRAS, 510, 5348 [NASA ADS] [CrossRef] [Google Scholar]
All Tables
All Figures
|
Fig. 1. Sunspot absolute maximum flux, Bspot, as a function of its flux deficit, log ΔFspot. The red line represents the linear fit given by Eq. (4). |
| In the text | |
|
Fig. 2. Spot magnetic field, Bspot, as a function of spot intensity, Ispot (left panel), and area, log Aspot (right panel). |
| In the text | |
|
Fig. 3. Average magnetic field of spots, Bspot, as a function of stellar age (top left), effective temperature (top right), rotation period (bottom left), and differential rotation shear (bottom right). Colours and symbols have the same meanings as in Fig. 2. Stellar parameters were obtained from the references listed in Table 1. |
| In the text | |
|
Fig. 4. Magnetic field measurements and estimates as a function of the stellar rotation period. Our results are displayed as red circles, the FGK and M stars observed by See et al. (2019) as blue triangles, the mean magnetic field of GK stars from Kochukhov et al. (2020) as open green squares, and the inferred field of magnetic regions as filled squares. The black circle represents the solar value. |
| In the text | |
Current usage metrics show cumulative count of Article Views (full-text article views including HTML views, PDF and ePub downloads, according to the available data) and Abstracts Views on Vision4Press platform.
Data correspond to usage on the plateform after 2015. The current usage metrics is available 48-96 hours after online publication and is updated daily on week days.
Initial download of the metrics may take a while.