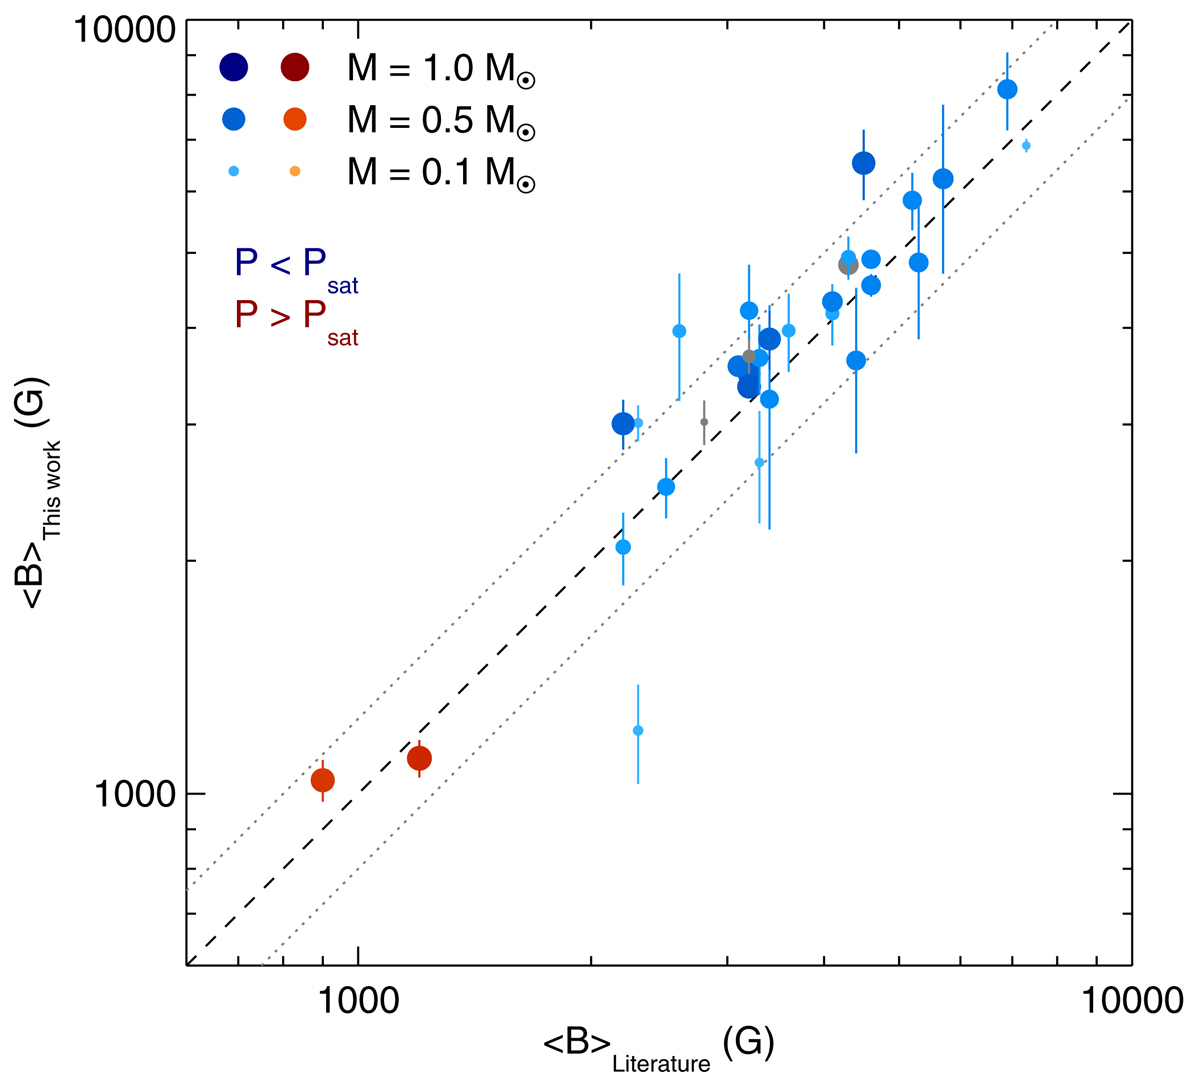
Fig. 2.
Download original image
Comparison of our average field measurements to literature values. Red and blue symbols indicate slow and fast rotators, respectively (see Sect. 4.3), and gray symbols show stars with no information on rotation period. Symbol size and brightness indicate stellar mass. The dashed black line shows identity between our measurements and literature values, and the gray dotted lines mark the region where the discrepancy is within ±25%.
Current usage metrics show cumulative count of Article Views (full-text article views including HTML views, PDF and ePub downloads, according to the available data) and Abstracts Views on Vision4Press platform.
Data correspond to usage on the plateform after 2015. The current usage metrics is available 48-96 hours after online publication and is updated daily on week days.
Initial download of the metrics may take a while.