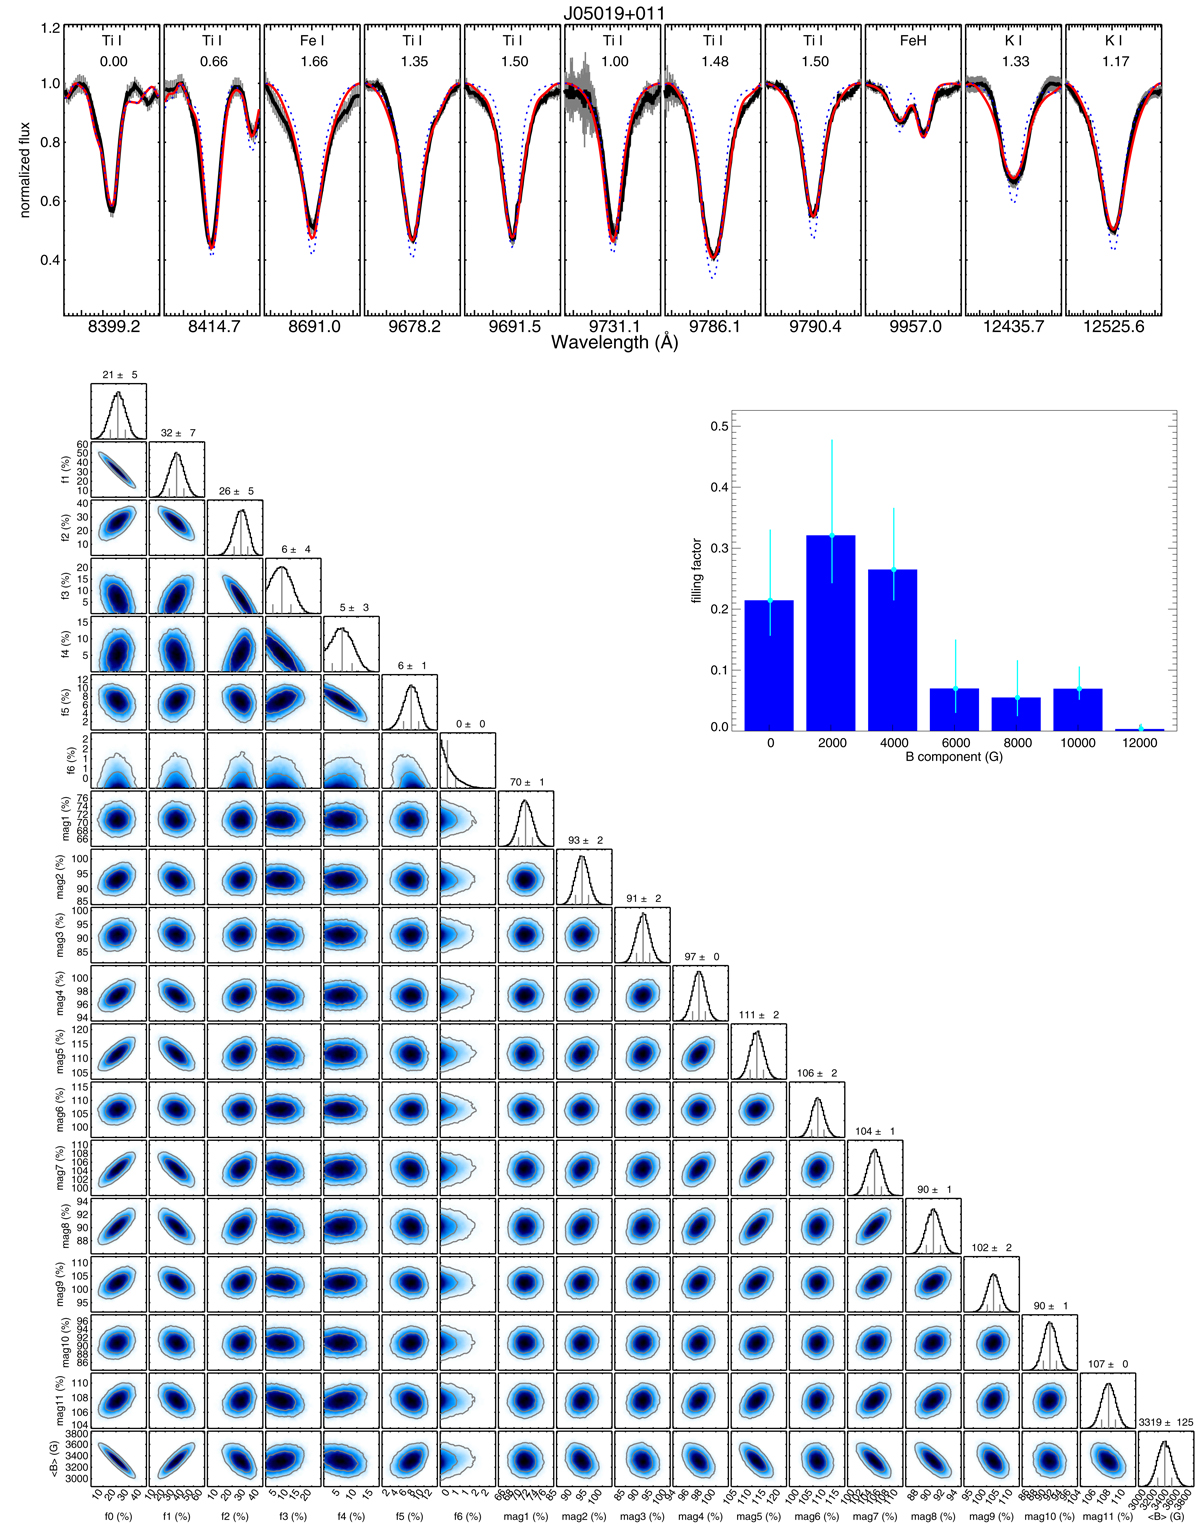
Fig. 1.
Download original image
Top panel: example fit for one of our stars; J05019+011 (M4.0 V). Data are shown as black line with uncertainties. The best fit solution is shown as red line, the best solution with ⟨B⟩=0 G as blue dashed line. The absorbing species are indicated together with the effective Landé-g factor for atomic lines. Bottom panel: cornerplot for posterior MCMC parameter distribution. In this example, six field components f1–f6 were used, and twelve lines were fit for which one scaling parameter (mag1–mag11) per line is shown. Corresponding lines are shown in the upper panel in the same order. The posterior distribution for ⟨B⟩=ΣBifi is included in the plot at the bottom row. Inset panel: relative distribution of filling factors fi for field components Bi. Uncertainties of individual field components are indicated as cyan lines.
Current usage metrics show cumulative count of Article Views (full-text article views including HTML views, PDF and ePub downloads, according to the available data) and Abstracts Views on Vision4Press platform.
Data correspond to usage on the plateform after 2015. The current usage metrics is available 48-96 hours after online publication and is updated daily on week days.
Initial download of the metrics may take a while.