Fig. 7.
Download original image
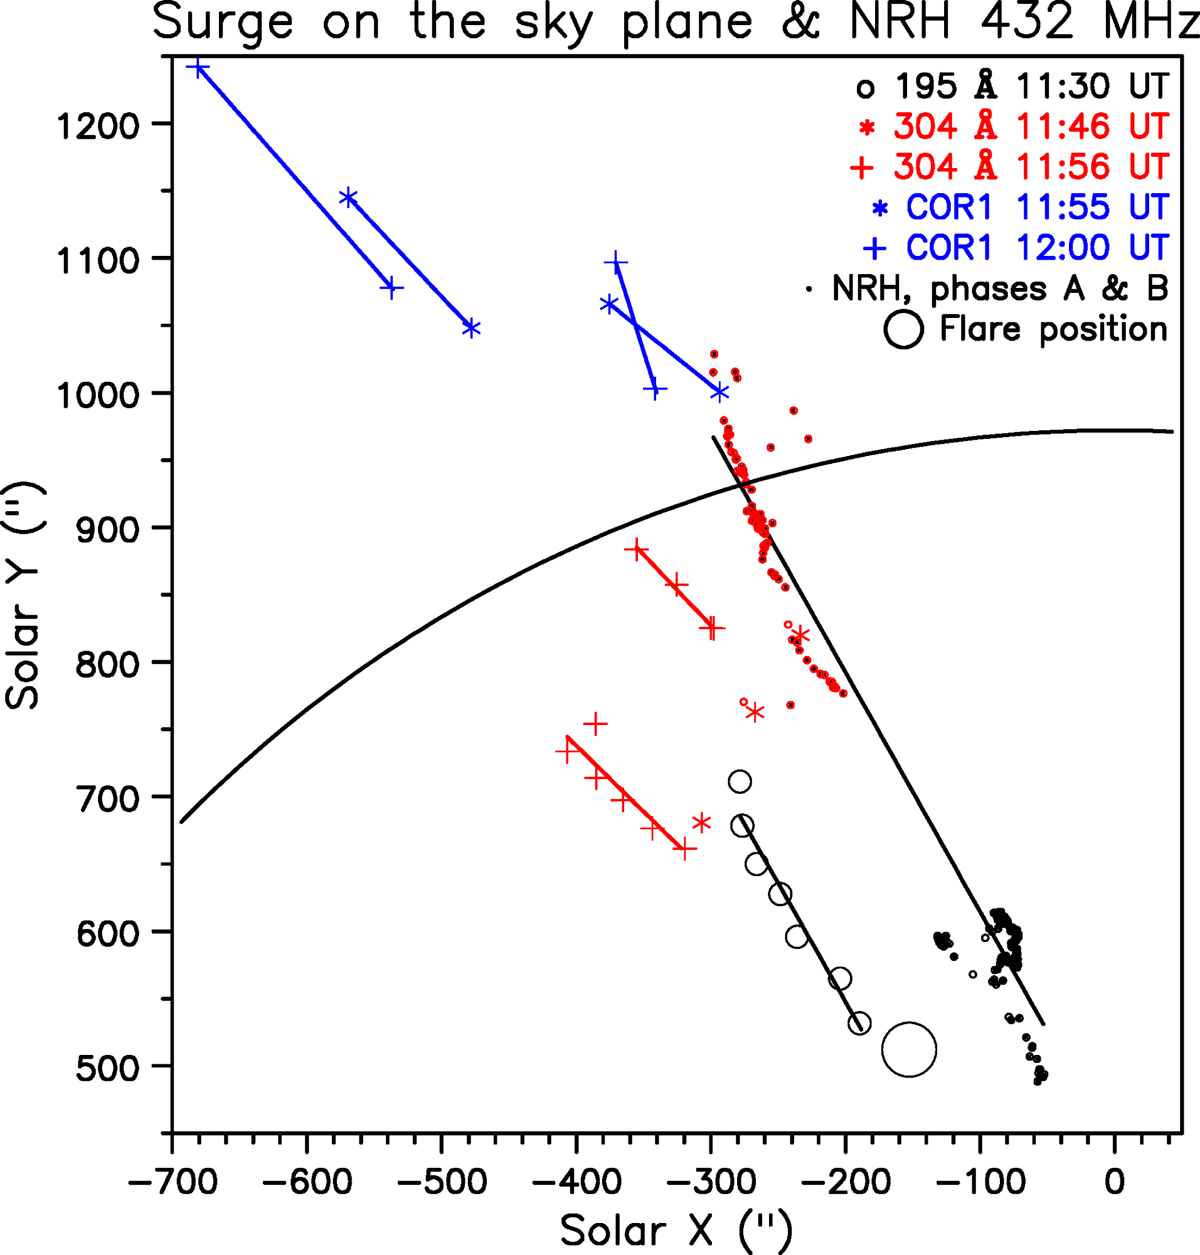
Positions of various components of the surge derived from triangulation of STEREO images, on the plane of the sky as seen from the Earth. The positions of the radio sources at 432.0 MHz are shown as black and red dots, for the lower and upper components of the emission respectively. The open circle shows the location of the flare. Straight lines are from linear regression. The black arc marks the solar limb.
Current usage metrics show cumulative count of Article Views (full-text article views including HTML views, PDF and ePub downloads, according to the available data) and Abstracts Views on Vision4Press platform.
Data correspond to usage on the plateform after 2015. The current usage metrics is available 48-96 hours after online publication and is updated daily on week days.
Initial download of the metrics may take a while.