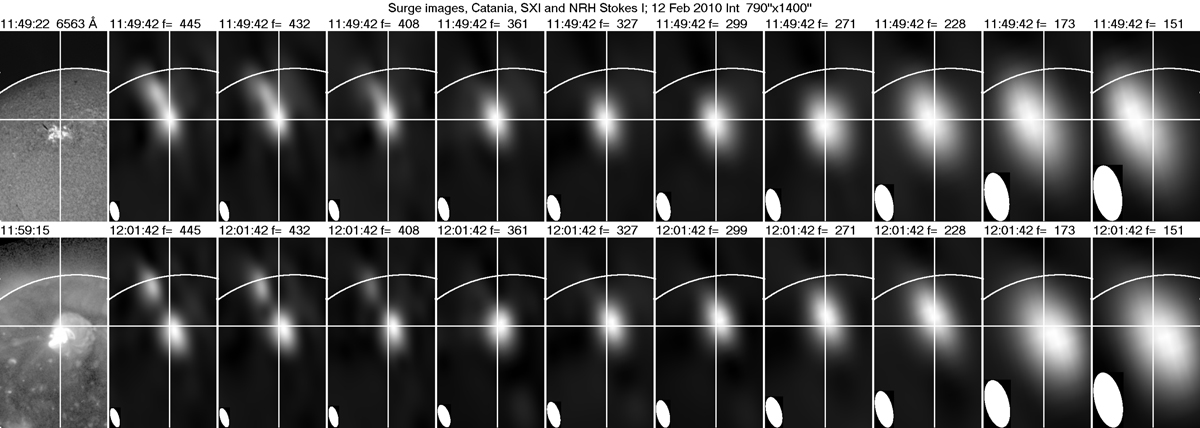
Fig. 4.
Download original image
NRH images in total intensity (Stokes parameter I) of the surge at all ten frequencies during the first (top) and the second (bottom) phase of the event. The white arc marks the solar limb, the insert shows the NRH beam (resolution), while the cross-hair is placed at the maximum of the lower source at 445 MHz during the first phase. The images are normalized so that the maximum intensity at each frequency is white and the minimum is black, with a linear scale (γ = 1.). An Hα image from Catania and a long exposure SXR image from SXI are given for reference in the left column.
Current usage metrics show cumulative count of Article Views (full-text article views including HTML views, PDF and ePub downloads, according to the available data) and Abstracts Views on Vision4Press platform.
Data correspond to usage on the plateform after 2015. The current usage metrics is available 48-96 hours after online publication and is updated daily on week days.
Initial download of the metrics may take a while.