Fig. A.2.
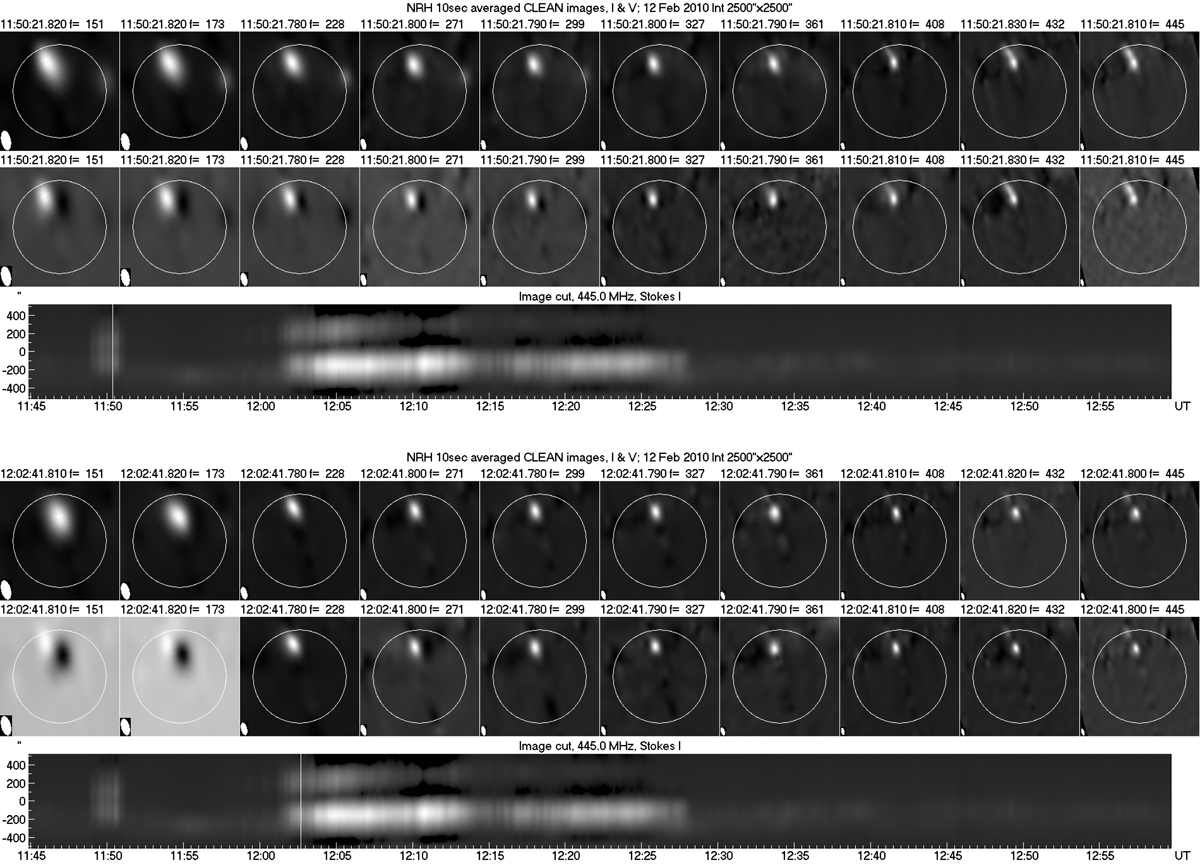
Download original image
Two frames of Movie 1, during phase A and at the beginning of phase B. Each frame shows radio images at all ten NRH frequencies in total intensity (top row) and circular polarization (middle row). The color table of each image is such that the maximum intensity is white and the minimum intensity is black. The instrumental beam is shown in the low left corner, while the white circle marks the photospheric limb. In the bottom row a cut of the intensity along the surge as a function of position and time is given, where the white vertical line marks the time of the images.
Current usage metrics show cumulative count of Article Views (full-text article views including HTML views, PDF and ePub downloads, according to the available data) and Abstracts Views on Vision4Press platform.
Data correspond to usage on the plateform after 2015. The current usage metrics is available 48-96 hours after online publication and is updated daily on week days.
Initial download of the metrics may take a while.