Fig. 16.
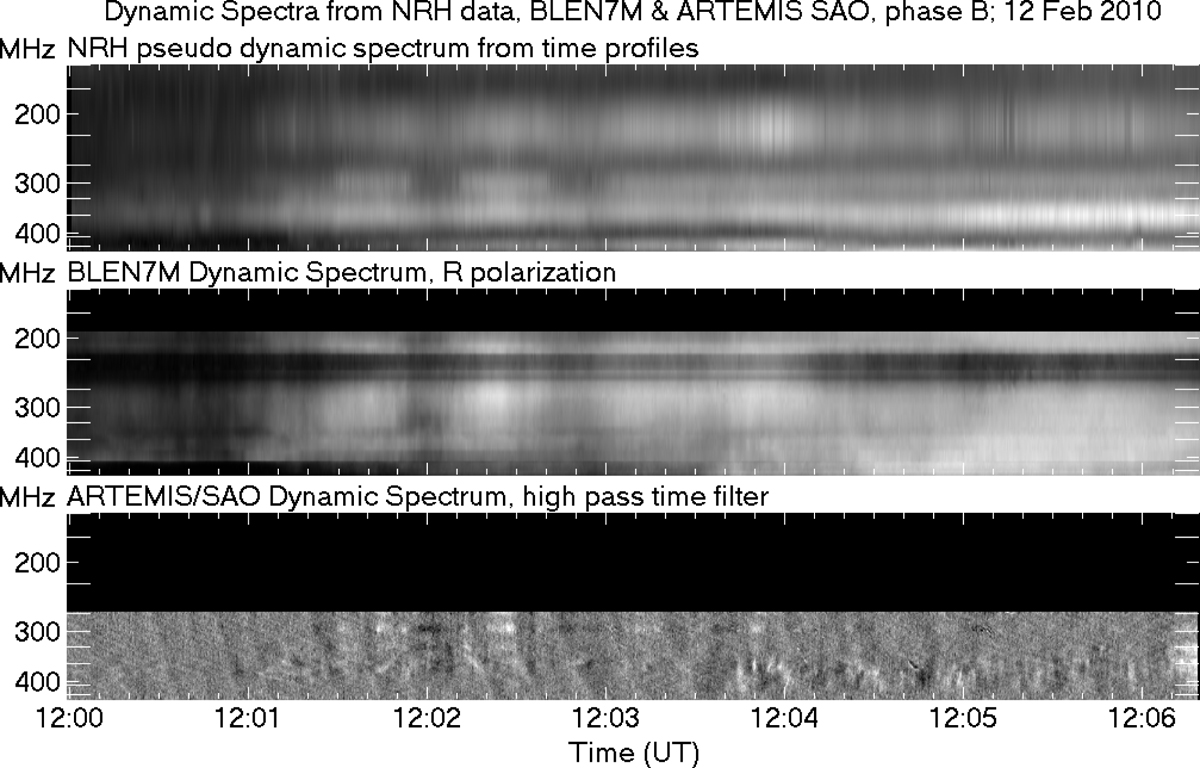
Download original image
Dynamic spectra from 12:00 to 12:06:20 UT, near the start of phase B of the surge from NRH imaging data (top), from e-Callisto of Bleien Observatory in right circular polarization (middle) and from the acousto-optic analyzer of ARTEMIS-JLS (bottom, subjected to high pass time filtering). Fringe-like patterns in the bottom panel are of instrumental origin.
Current usage metrics show cumulative count of Article Views (full-text article views including HTML views, PDF and ePub downloads, according to the available data) and Abstracts Views on Vision4Press platform.
Data correspond to usage on the plateform after 2015. The current usage metrics is available 48-96 hours after online publication and is updated daily on week days.
Initial download of the metrics may take a while.