Free Access
Fig. 15.
Download original image
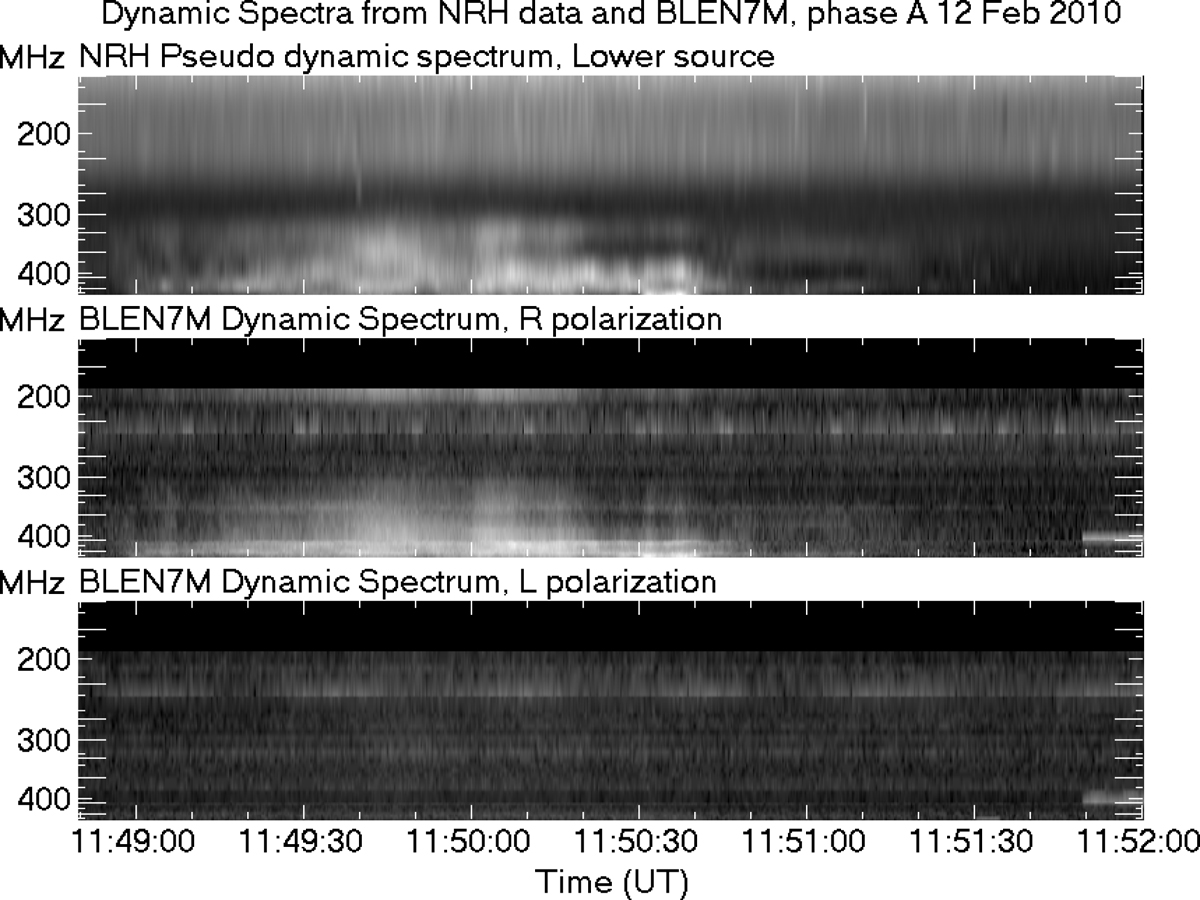
Dynamic spectra during phase A of the surge from NRH imaging data (top) and from e-Callisto of Bleien Observatory in right and left circular polarization (middle and bottom) in the frequency range 150–525 MHz. Horizontal line segments at left and at right mark the NRH frequencies. The time interval is the same as in Fig. 9.
Current usage metrics show cumulative count of Article Views (full-text article views including HTML views, PDF and ePub downloads, according to the available data) and Abstracts Views on Vision4Press platform.
Data correspond to usage on the plateform after 2015. The current usage metrics is available 48-96 hours after online publication and is updated daily on week days.
Initial download of the metrics may take a while.