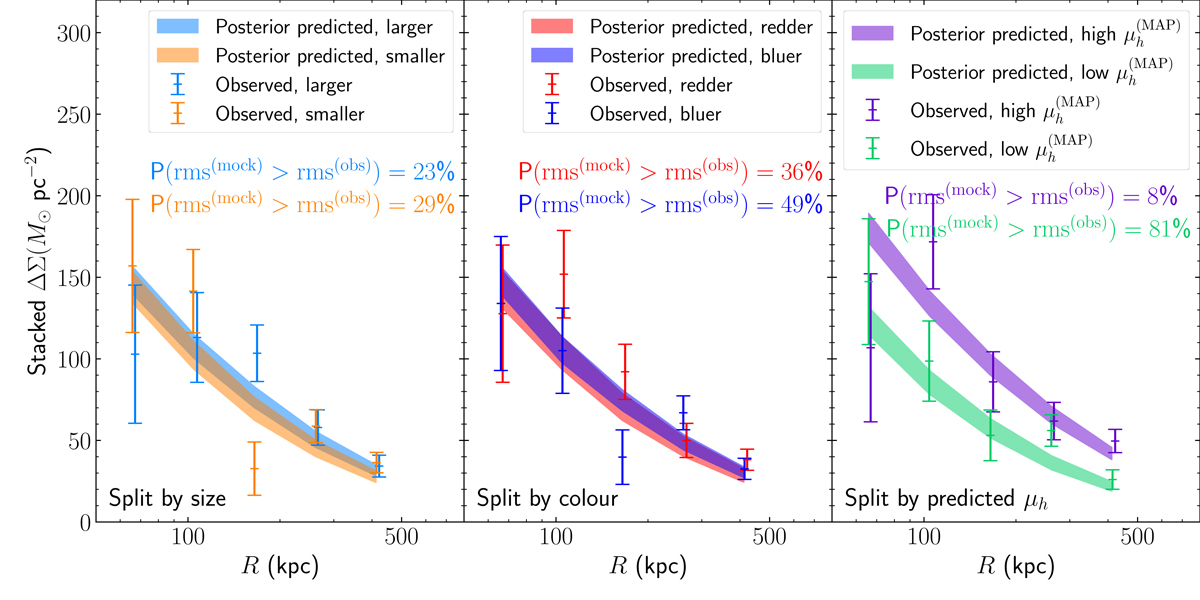
Fig. 4.
Download original image
Stacked excess surface mass density profile of the lenses in our sample. The sample is split into two bins according to size (left panel), colour (middle panel), and predicted average halo mass, depending on the maximum a posteriori value of μh defined in Eq. (24) (right panel). The error bars show the excess surface mass density obtained by stacking the observed tangential ellipticity in five radial bins. The bands show the same quantity obtained by posterior prediction from our model, without adding shape noise. For each sub-sample, the figure reports the probability of obtaining a scatter around the posterior predicted ΔΣ profile larger than the observed value, under the assumption that the model describes the truth. Small values for this quantity may indicate that the model is unable to reproduce these observations. Error bars have been offset slightly in the horizontal direction, for clarity.
Current usage metrics show cumulative count of Article Views (full-text article views including HTML views, PDF and ePub downloads, according to the available data) and Abstracts Views on Vision4Press platform.
Data correspond to usage on the plateform after 2015. The current usage metrics is available 48-96 hours after online publication and is updated daily on week days.
Initial download of the metrics may take a while.