Fig. 8.
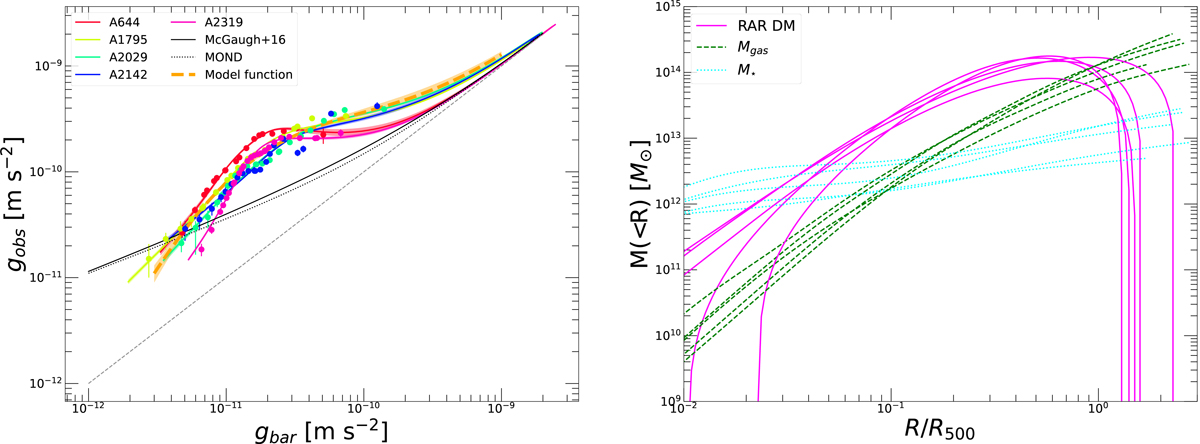
Download original image
Modeling of the RAR in galaxy clusters. Left: same as in Fig. 7. The thick dashed orange curve and shaded area show the best fit to the NP data with the model that describes two transitions (Eq. (20)) and its corresponding 1σ error envelope. The dotted line shows the classical MOND relation. Right: breakdown of the various mass components in the RAR paradigm for the five systems with complete descriptions of the baryonic components assuming that the McGaugh et al. (2016) relation is universal. The curves show the cumulative radial profiles of the gas mass (dashed green), stellar mass (dotted cyan), and the required missing MDM, RAR computed using Eq. (21) (solid magenta).
Current usage metrics show cumulative count of Article Views (full-text article views including HTML views, PDF and ePub downloads, according to the available data) and Abstracts Views on Vision4Press platform.
Data correspond to usage on the plateform after 2015. The current usage metrics is available 48-96 hours after online publication and is updated daily on week days.
Initial download of the metrics may take a while.