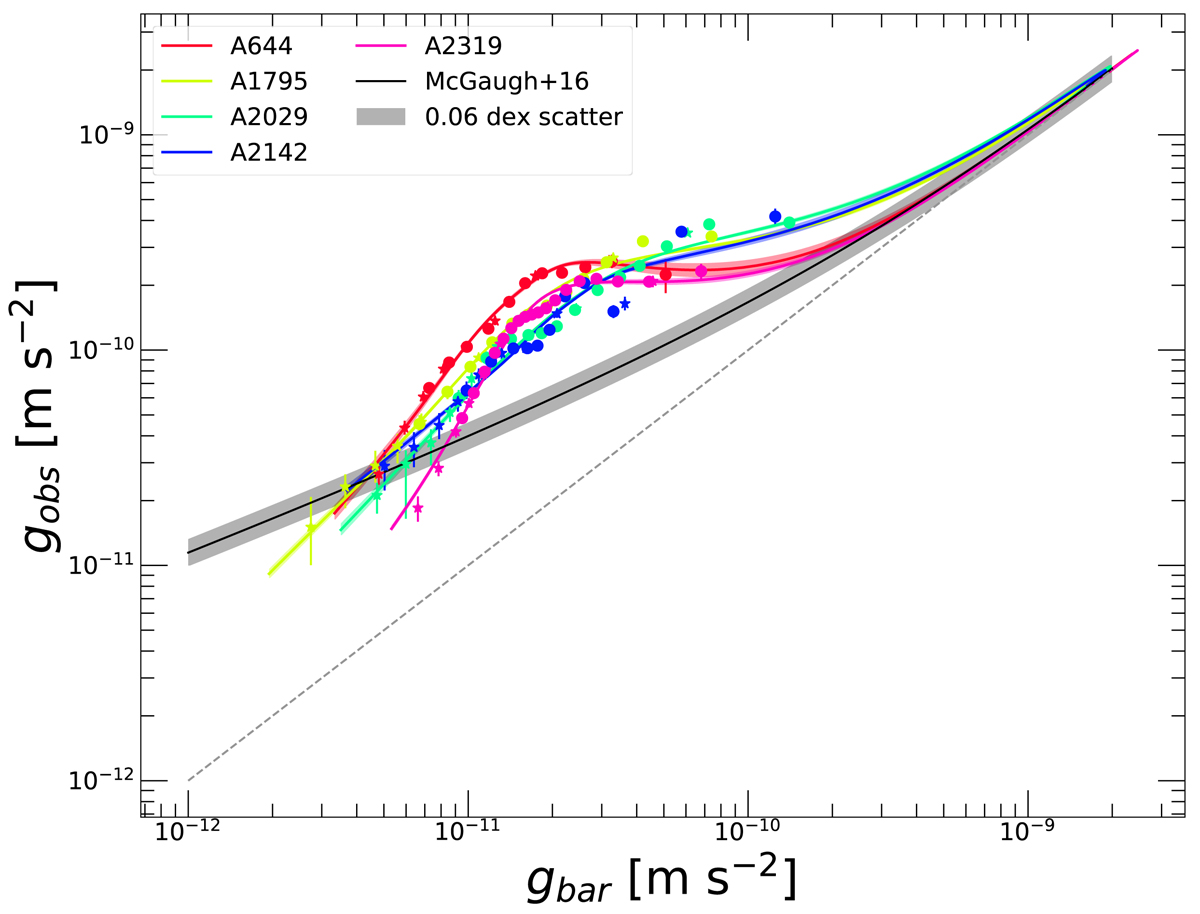
Fig. 7.
Download original image
Radial acceleration relation for X-COP galaxy clusters. The solid colored curves show the result of the Einasto fit to the baryons+DM model, whereas the individual data points indicate the accelerations computed using the nonparametric log-normal mixture model (NP). For comparison, the solid black curve and shaded area show the RAR obtained by McGaugh et al. (2016) for rotationally supported galaxies and the associated 0.06 dex scatter. The dashed line indicates the one-to-one relation.
Current usage metrics show cumulative count of Article Views (full-text article views including HTML views, PDF and ePub downloads, according to the available data) and Abstracts Views on Vision4Press platform.
Data correspond to usage on the plateform after 2015. The current usage metrics is available 48-96 hours after online publication and is updated daily on week days.
Initial download of the metrics may take a while.