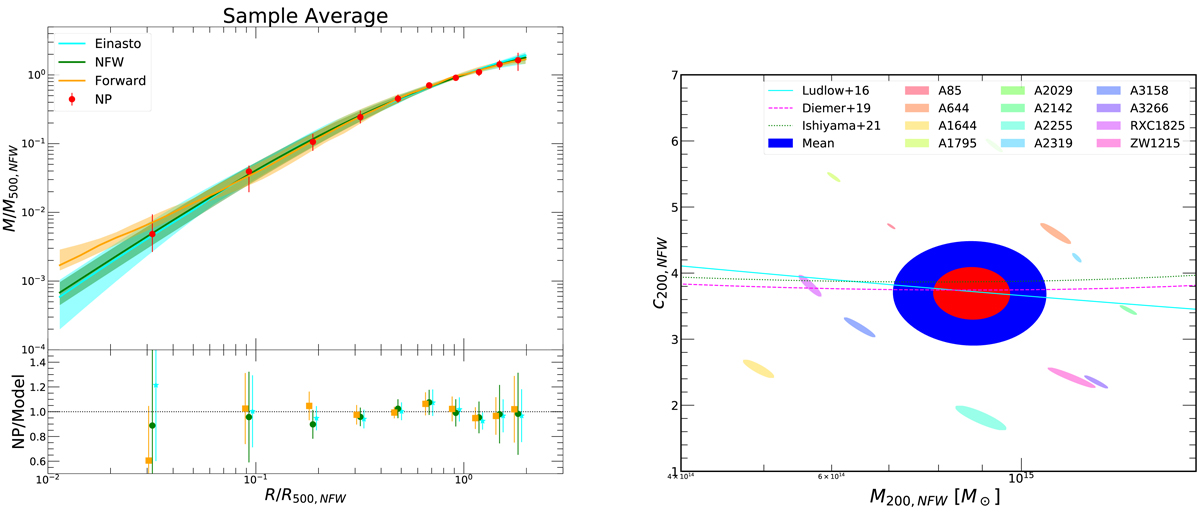
Fig. 4.
Download original image
Average profile shapes. Left: median scaled mass profiles for the four methods investigated here. The bottom panel shows the median ratio of NP to model, with the error bars indicating the 68% interval. The ratios are evaluated at the same radius but are slightly shifted for better readability. Right: NFW mass-concentration relation for our sample. The small shaded ellipses indicate the 1σ contours of the fitted individual values for the 12 X-COP clusters individually, whereas the solid red and blue ellipses show the fitted sample mean and its 1σ and 2σ confidence regions, respectively. The curves show the predictions of N-body simulations (Ludlow et al. 2016; Diemer & Joyce 2019; Ishiyama et al. 2021).
Current usage metrics show cumulative count of Article Views (full-text article views including HTML views, PDF and ePub downloads, according to the available data) and Abstracts Views on Vision4Press platform.
Data correspond to usage on the plateform after 2015. The current usage metrics is available 48-96 hours after online publication and is updated daily on week days.
Initial download of the metrics may take a while.