Fig. 3.
Download original image
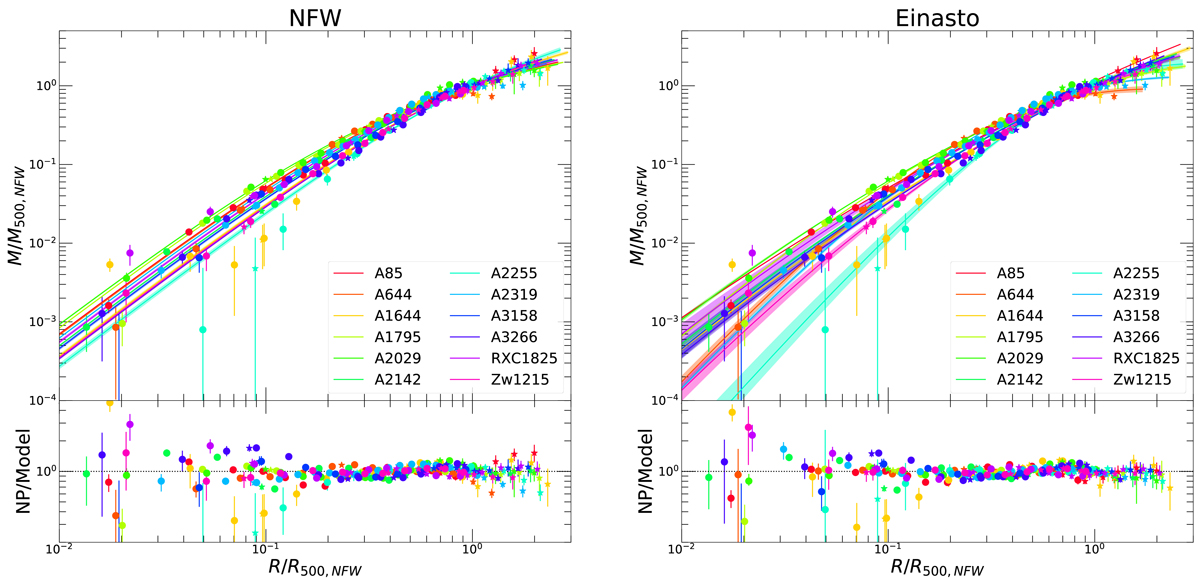
Comparison between the mass profiles reconstructed using mass models (solid curves and shaded areas) and the nonparametric log-normal mixture method (data points). The results obtained for the NFW and Einasto profile are shown in the left and right panels, respectively. The data points show the posterior NP mass estimates at the radii of the X-ray spectral data (circles) and the SZ pressure data (asterisks). For clarity, all the profiles are scaled by the NFW values for R500 and M500. The bottom panels show the local ratio of NP to model.
Current usage metrics show cumulative count of Article Views (full-text article views including HTML views, PDF and ePub downloads, according to the available data) and Abstracts Views on Vision4Press platform.
Data correspond to usage on the plateform after 2015. The current usage metrics is available 48-96 hours after online publication and is updated daily on week days.
Initial download of the metrics may take a while.