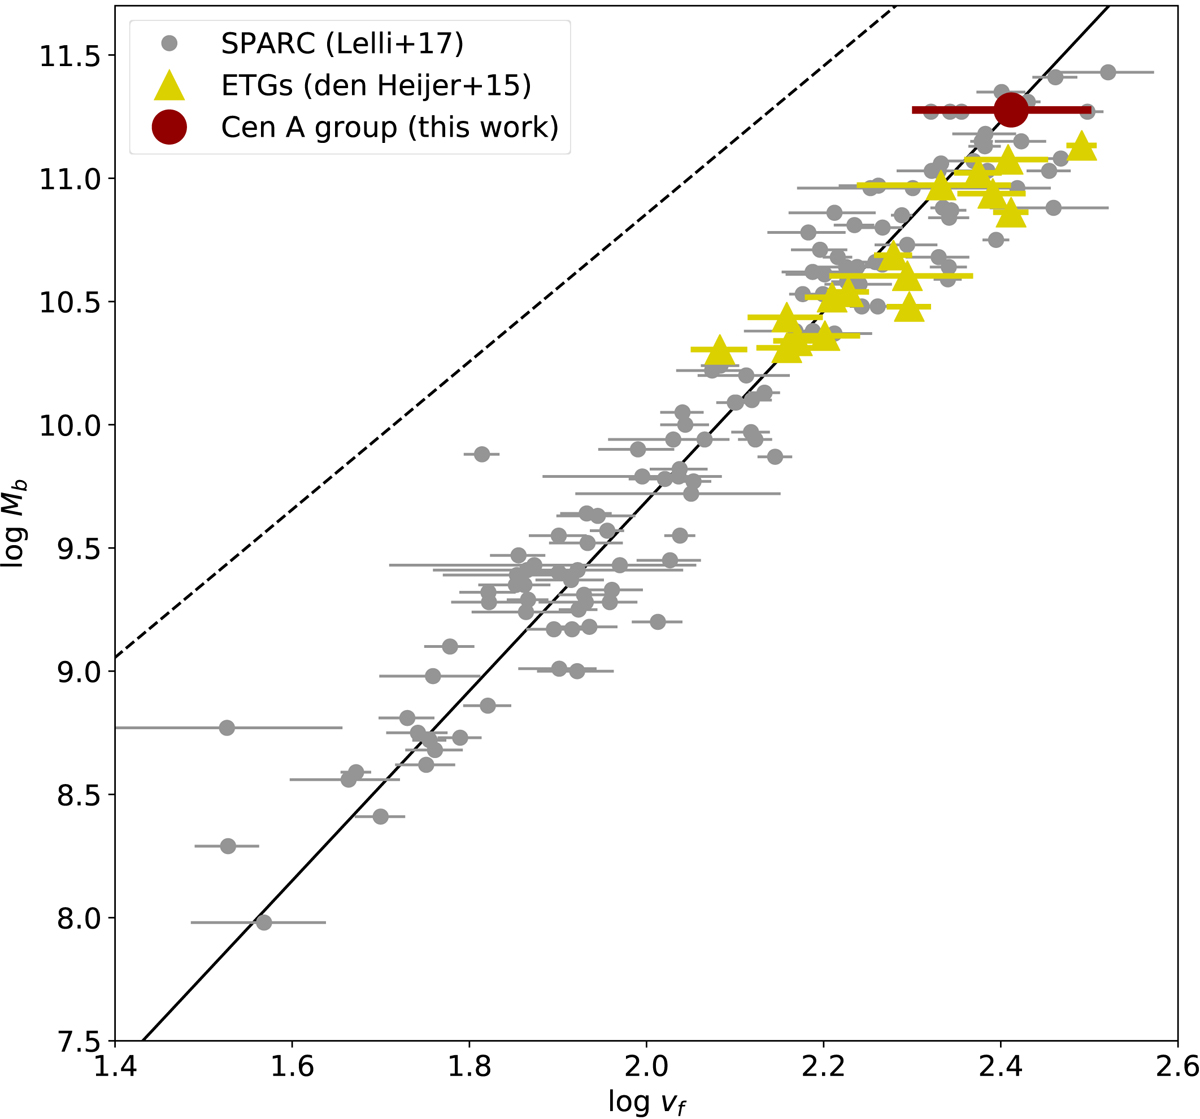
Fig. 3.
Download original image
BTFR of galaxies. The gray dots are late-type galaxies taken from the SPARC database (Lelli et al. 2016b, 2019), the yellow triangles are early-type galaxies (ETGs) from den Heijer et al. (2015), and the red dot indicates our measurement of the Cen A group. The black line is the best fit of the BTFR, and the dashed line is the ΛCDM prediction assuming the cosmic baryon fraction (Planck Collaboration VI 2020).
Current usage metrics show cumulative count of Article Views (full-text article views including HTML views, PDF and ePub downloads, according to the available data) and Abstracts Views on Vision4Press platform.
Data correspond to usage on the plateform after 2015. The current usage metrics is available 48-96 hours after online publication and is updated daily on week days.
Initial download of the metrics may take a while.