Fig. 2.
Download original image
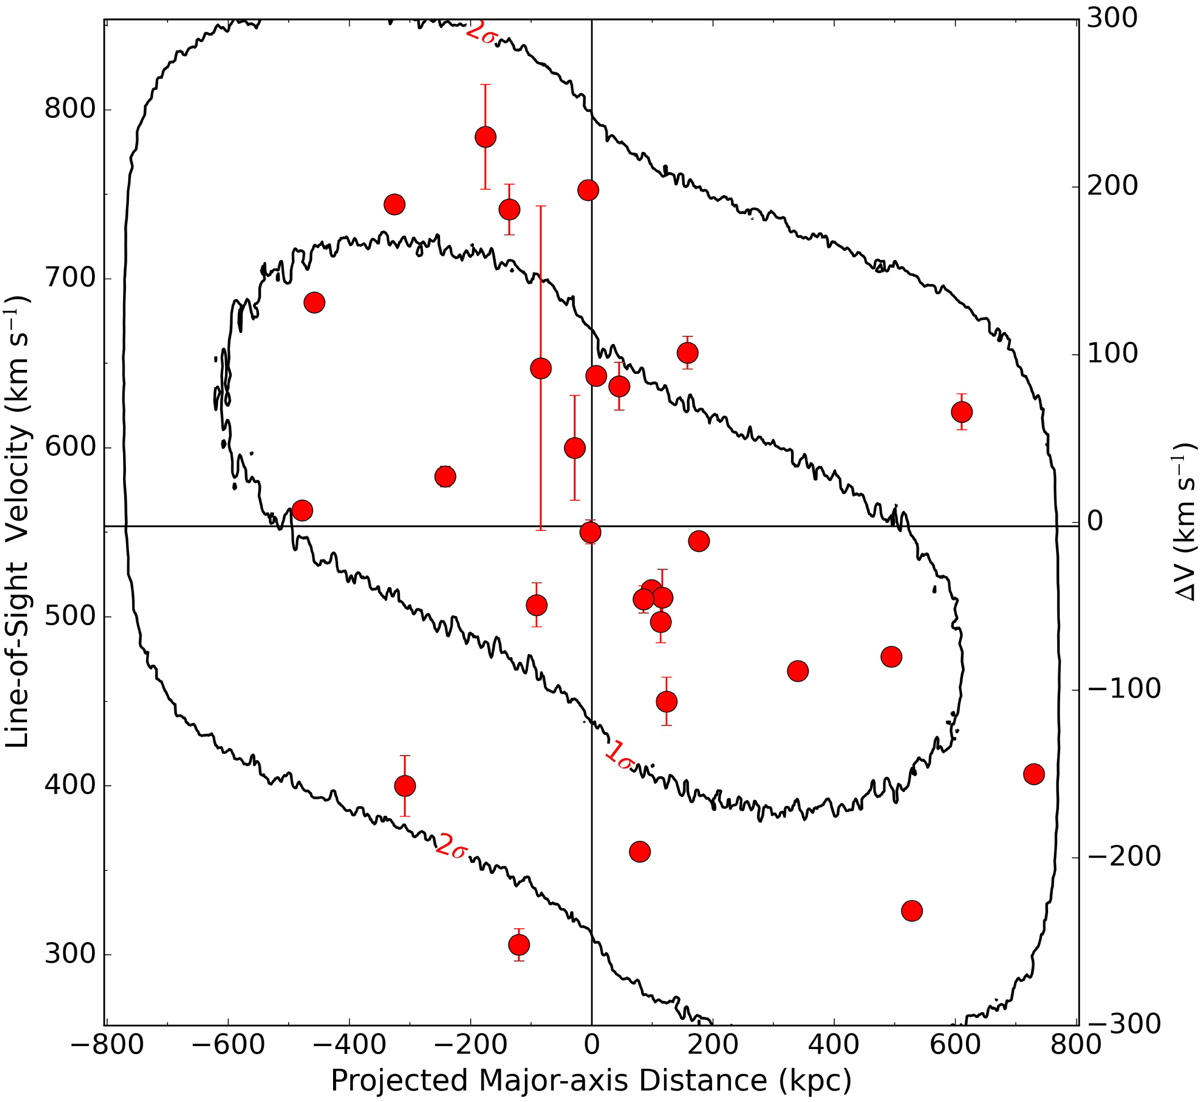
Position-velocity diagram along the projected major axis of the satellite system. Red dots with 1σ error bars show satellites of Cen A with measured line-of-sight velocities. The contours represent the best-fit rotating disk model with vrot = 90 km s−1 and σint = 124 km s−1. The inner and outer contours correspond to 1σ and 2σ probabilities of finding a galaxy at that location of the position-velocity diagram.
Current usage metrics show cumulative count of Article Views (full-text article views including HTML views, PDF and ePub downloads, according to the available data) and Abstracts Views on Vision4Press platform.
Data correspond to usage on the plateform after 2015. The current usage metrics is available 48-96 hours after online publication and is updated daily on week days.
Initial download of the metrics may take a while.