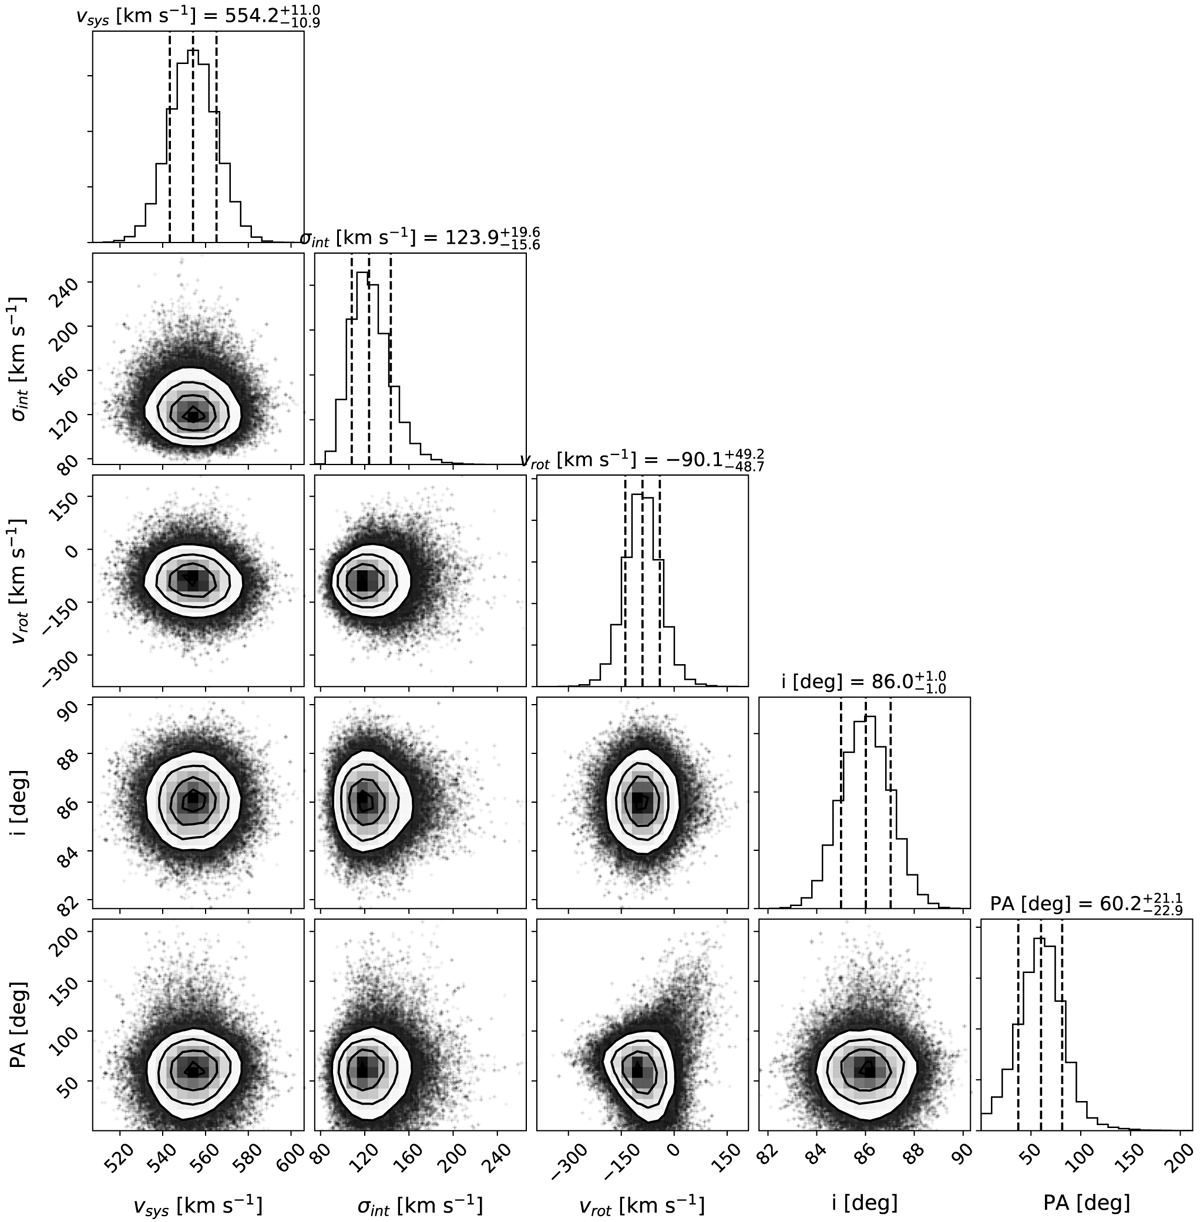
Fig. 1.
Download original image
Posterior distribution of the five fitting parameters from the MCMC analysis of the Cen A satellite system. In the histograms, the three dashed lines indicate the 16, 50, and 84 percentiles, which correspond to the upper and lower uncertainty boundaries, and the best-fit parameter estimation (i.e., the median). See Sect. 2 for details.
Current usage metrics show cumulative count of Article Views (full-text article views including HTML views, PDF and ePub downloads, according to the available data) and Abstracts Views on Vision4Press platform.
Data correspond to usage on the plateform after 2015. The current usage metrics is available 48-96 hours after online publication and is updated daily on week days.
Initial download of the metrics may take a while.