Fig. 7
Download original image
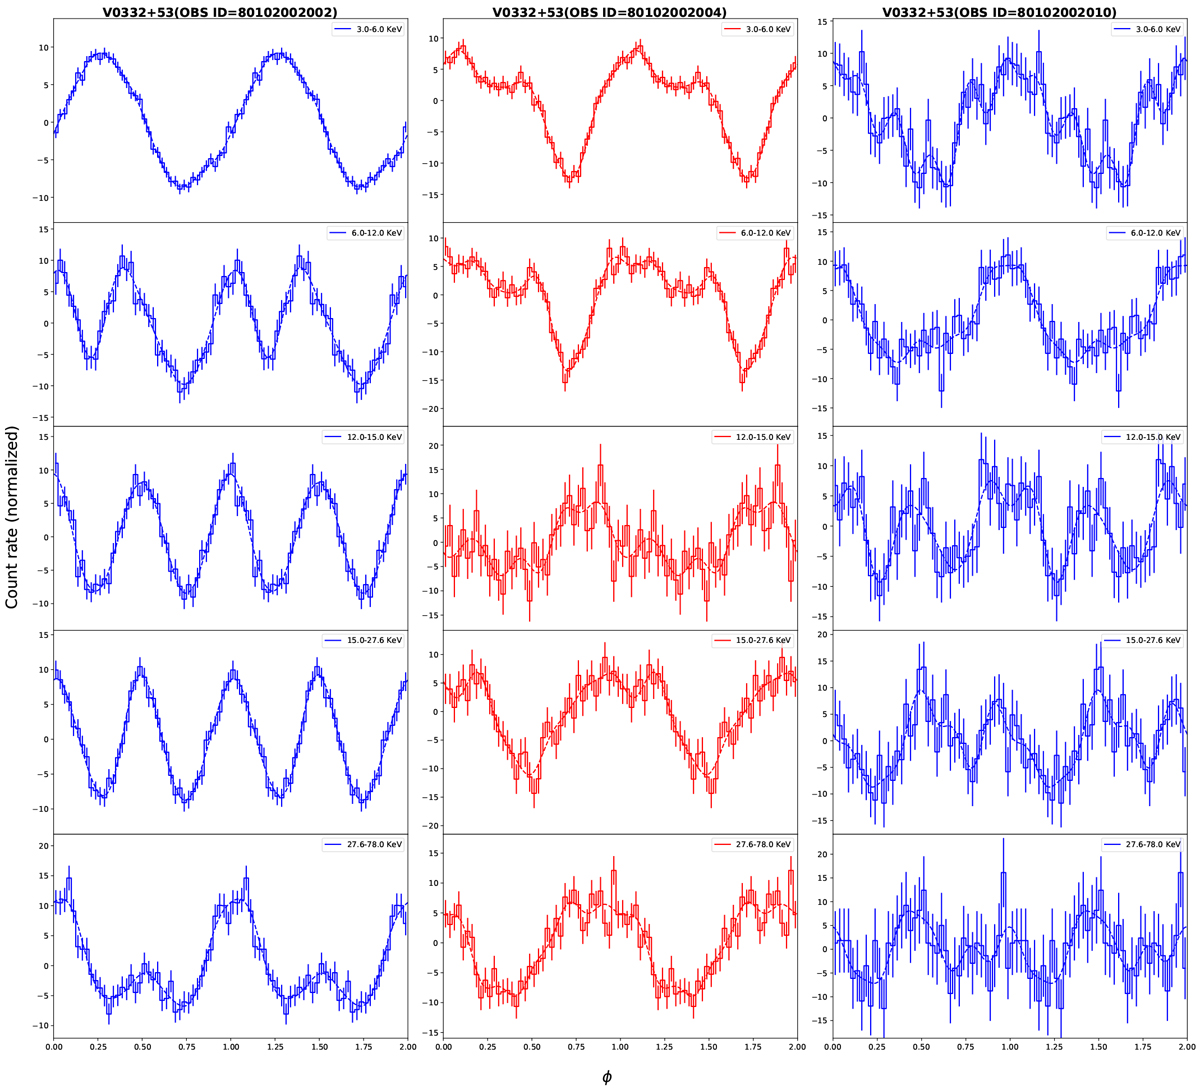
Comparison of normalized pulse profiles of source V 0332+53 studied at different energy ranges in different stages during a flare period. The observations are in temporal order from left to right: observation with OBS ID = 80102002002 and a luminosity value of (1.24–1.74) × 1038 erg s−1 with a pulse profile type 2; observation with OBS ID = 80102002004 and a luminosity value of (5.7–9.5) × 1037 erg s−1 with a pulse profile type 0; observation with OBS ID = 80102002010 and a luminosity value of (5.3–14) × 1036 erg s−1 with a pulse profile type 2. The measured profiles are represented by solid lines, whereas the Fourier fits are represented by dashed lines. The boundaries of the energy ranges are [0.5, 3, 6, 12, 15, 27.6, and 78] keV. The pulse profiles were shifted by hand to align the minima of the pulse profiles and coloured according to their respective pulse profile types in order to better show a comparison between them.
Current usage metrics show cumulative count of Article Views (full-text article views including HTML views, PDF and ePub downloads, according to the available data) and Abstracts Views on Vision4Press platform.
Data correspond to usage on the plateform after 2015. The current usage metrics is available 48-96 hours after online publication and is updated daily on week days.
Initial download of the metrics may take a while.