| Issue |
A&A
Volume 686, June 2024
|
|
|---|---|---|
| Article Number | A145 | |
| Number of page(s) | 5 | |
| Section | Astrophysical processes | |
| DOI | https://doi.org/10.1051/0004-6361/202348998 | |
| Published online | 05 June 2024 | |
Detection of a cyclotron line in the Be X-ray pulsar IGR J06074+2205
Raman Research Institute, C. V. Raman Avenue, Sadashivanagar, Bengaluru 560 080, India
e-mail: This email address is being protected from spambots. You need JavaScript enabled to view it.
Received:
18
December
2023
Accepted:
8
February
2024
Abstract
Context. IGR J0607.4+2205 is a transient Be X-ray binary discovered two decades ago. IGR J0607.4+2205 underwent an outburst in 2023 during which it was observed twice with NuSTAR.
Aims. The main goal of this work is to model the broadband X-ray spectrum of IGR J0607.4+2205 during the outburst and to study the variations of the spectral and timing features at different intensities.
Methods. We extracted the light curve and spectrum of the source from the two NuSTAR observations carried out during the recent outburst in the energy range of 3−78 keV. We used the epoch folding technique to find pulsation from the source and to study the changes in emission characteristics from the source with energy across an order of magnitude variation in source luminosity.
Results. IGR J0607.4+2205 shows pulsations with a period of ∼347.6 s during both the observations, with a pulse fraction of ≥50%. The broadband spectrum of the source was modelled using a power-law continuum with a high-energy cutoff. During the first observation, a cyclotron absorption line at ∼51 keV was also present in the source with an optical depth of ∼1.3. However, no cyclotron line feature was detected in the second observation when the source was an order of magnitude fainter. Additionally, soft excess was detected in the second observation, which was modelled with a black body component emerging from close to the neutron star (NS).
Conclusions. We report the first ever detection of a cyclotron line in the broadband spectrum of IGR J0607.4+2205 centred at 51 ± 1 keV. The magnetic field strength of the NS is estimated to be ∼4 × 10¹² G from the centroid energy of the absorption line. A significant change is observed in the pulse profile with luminosity during the decay of the outburst, indicating an associated change in the beaming pattern.
Key words: pulsars: individual: IGR J0607.4+2205
© The Authors 2024
 Open Access article, published by EDP Sciences, under the terms of the Creative Commons Attribution License (https://creativecommons.org/licenses/by/4.0), which permits unrestricted use, distribution, and reproduction in any medium, provided the original work is properly cited.
This article is published in open access under the Subscribe to Open model. This email address is being protected from spambots. You need JavaScript enabled to view it. to support open access publication.
1. Introduction
Transient X-ray binary pulsars (XRPs) with a Be-type main sequence companion (BeXRPs) are useful for studying accretion onto highly magnetised neutron stars (NSs). The BeXRPs are known to exhibit a wide range of luminosity, ranging from 1037 − 38 erg s−1 during the peak of the outburst to 1032 − 34 erg s−1 during the quiescence phase (Tsygankov et al. 2017). Many BeXRPs have been detected since the launch of the first X-ray telescopes (Malacaria et al. 2020). Pioneered by the highly successful RXTE-ASM (Levine et al. 1996), the practice of initiating observations soon after the onset of an outburst has become standard. Recent advancements in sensitive, wide-viewing-angle X-ray instruments such as MAXI/GSC (Matsuoka et al. 2009), Swift/BAT (Krimm et al. 2013), and Fermi/GBM (Malacaria et al. 2020) enable the prompt identification of transients entering an outburst. Subsequent follow-up observations with sensitive broadband instruments like NuSTAR (Harrison et al. 2013) allow comprehensive studies of the source characteristics across a wide range of energy.
In highly magnetised (B ≥ 1012 G) high-mass X-ray binary (HMXB) systems, the accreted matter gets channelled along the magnetic field lines to the poles of the NS. A hot spot is produced in the accretion mound near the magnetic poles of the NS, producing soft X-rays that undergo inverse-Compton scattering by electrons in the accretion column giving rise to strong X-ray emissions (Becker & Wolff 2007). The presence of strong magnetic fields at the polar regions leads to the quantisation of electron energy levels (En) in accordance with the Landau levels (Meszaros 1992) given by En ∼ 11.6 × n × B12 keV, where B12 is the magnetic field strength in units of 1012 G and n = 1,2,3,4,... denotes the different levels. The cyclotron resonant scattering feature (CRSF) is the absorption feature in the spectra of pulsars due to interactions between photons and quantised electrons present in the line-forming region of the NS. CRSFs are the best diagnostic tool for studying the magnetic field strength of a NS. The CRSF is detected in the hard X-ray regime and is observed as absorption-like features (Staubert et al. 2019).
The source IGR J0607.4+2205 was discovered by the JEM-X instrument on board INTEGRAL (Chenevez et al. 2004). A follow-up Chandra observation of the source was performed to localise the source (Tomsick et al. 2006). Subsequent observations of the source using XMM-Newton (Reig & Zezas 2018) revealed pulsations at a period of 347.2 s, establishing the compact object as a NS. The companion of IGR J0607.4+2205 was found to be a B0.5Ve star establishing the source as a BeXRP, and the distance to the source was estimated to be 4.5 kpc (Reig et al. 2010). The source IGR J0607.4+2205 underwent an outburst in the beginning of October 2023 with coherent pulsation detected at 2.6700(2) mHz from Fermi/GBM (Malacaria et al. 2023). The source underwent three outbursts during 2022–2023 as observed with MAXI/GSC, and based on the assumption that the outbursts were type-I outbursts, the orbital period was calculated to be either 80 days or an integral division of the same; that is, 80/n days, where n = 2, 3… (Mihara et al. 2023). However, further observations are required to find the exact orbital period of IGR J0607.4+2205.
NuSTAR subsequently made two target of opportunity (TOO) observations of the source after the detection of the outburst in 2023. We report the results obtained from the spectral and timing analysis of the two TOO observations of IGR J0607.4+2205. The primary focus of this work is on the broadband spectral characteristics of IGR J0607.4+2205 and the detection of a CRSF at ∼51 keV.
2. Observations and data reduction
The light curve for the October 2023 outburst was obtained from the MAXI1 website in the 2 − 20 keV energy range. The light curve was also obtained from Swift/BAT transient monitoring mission2. The light curves from MAXI/GSC and Swift/BAT are plotted in Fig. 1 with a bin size of 1 day and 5 days, respectively.
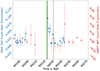 |
Fig. 1. Long-term light curve from MAXI/GSC (in blue) and Swift/BAT (in red) plotted with a bin size of 1 day and 5 days, respectively. The green line denotes the epoch and duration of the first observation, while the second observation is shown in orange. |
The first of the two TOO observations was made on 8 October 2023 (MJD 60225; Obs ID: 90901331002; henceforth ObsID 02) with an effective exposure of ∼42 ks, while the second observation was made on 15 October 2023 (MJD 60232; Obs ID: 90901331004; henceforth ObsID 04) with an effective exposure of ∼40 ks. The two NuSTAR observations are marked in Fig. 1 along with the 2−20 keV MAXI/GSC and 15−50 keV Swift/BAT light curves of the source.
The NuSTAR data were reduced using HEASOFT version 6.30.1 along with the latest calibration files available via CALDB version 20231205. The nupipeline version 0.4.9 was used to produce the clean event files and the nuproduct command was used to extract the light curves and spectrum of the source and background regions. A circle of 150 arcsec in radius around the source position was used to extract the level 2 source products and a circle of the same radius away from the source region was used to extract the background products for ObsID 02. For ObsID 04, the source and background region were respectively selected from a circle of 80 arcsec in radius around the source position and a circle of similar radius away from any known sources. Barycenter correction was performed using barycorr version 2.16. All the spectral files were optimally binned (Kaastra & Bleeker 2016). The broadband (3−78 keV) count rate of the source changed from 36 cts/s for ObsID 02 to 1.28 cts s−1 in the second observation.
3. Analysis and results
3.1. Timing analysis
The spin period of the source was found to be 374.60(1) s for ObsID 02 using the epoch-folding tool efsearch. For ObsID 04, the spin period decreased to 374.62(1) s. The broadband (3−78 keV) pulse profiles from the two observations are shown in the top panel of Fig. 2, where the minima of the two pulse profiles are aligned. The pulse profile for ObsID 02 was double-humped in nature, with some subpulse structures. The pulse profile changed significantly for ObsID 04 with the overall shape change of the individual peaks. We studied the energy-resolved pulse profile for both observations. We extracted pulse profiles in the energy ranges of 3−7, 7−10, 10−20, 20−40, 40−60, and 60−78 keV.
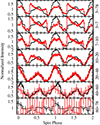 |
Fig. 2. Normalised pulse profiles of combined FPMA and FPMB light curves from ObsID 02 (black) and ObsID 04 (red). The top panel consists of the pulse profile in the energy range of 3−78 keV. The remaining panels show the energy-resolved profiles in the energy ranges of 3−7, 7−10, 10−20, 20−40, 40−60, and 60−78 keV, respectively. |
The pulse profile of ObsID 02 has a distinct main peak and a smaller peak separated by a pulse phase of ∼0.5. With an increase in the energy, the overall pulse shape remains the same, with the amplitude of modulation changing with energy.
The broadband 3−78 keV pulse profile for ObsID 04 exhibited notable modifications in pulse shape compared to ObsID 02. Instead of a main and secondary peak, a smaller peak emerged near the phase corresponding to the main peak in ObsID 02, coupled with a broader peak around the phase where the second peak was observed in ObsID 02. The overall pulse shape changed significantly with energy in ObsID 04. The low-energy, folded profiles show multiple peaks below ∼20 keV. However, above 20 keV, the pulse profile becomes double humped with a primary peak and a smaller peak, similar to that in ObsID 02.
To quantify the changes in modulation in the amplitude of pulse profiles, we define the pulse fraction (PF) as PF=(max-min)/(max+min), where max and min correspond to the maximum and minimum of the pulse profile. The variation of PF with energy is plotted in Fig. 3 for both observations. We see an increasing trend of pulse fraction with energy until about 40 keV, beyond which there is a decrease in PF with energy, which is most prominent in ObsID 02. With the present data quality, it is not possible to comment on weather or not the decrease in pulse profile may be due to the presence of CRSF.
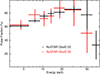 |
Fig. 3. Variation of the pulsed fraction with energy for the two NuSTAR observations ObsID 02 (in black) and ObsID 04 (in red). |
3.2. Spectral analysis
The phase-averaged spectra of IGR J0607.4+2205 from the two focal plane modules (FPMs) of NuSTAR were fitted together allowing for a relative normalisation between the two (in accordance with Madsen et al. 2015). All other parameters were tied between the two spectra. The entire spectral analysis was carried out using XSPEC version 12.12.1 (Arnaud 1996).
The NuSTAR broadband continuum spectrum of ObsID 02 was fitted with a power-law emission with a high-energy cutoff. The continuum model was multiplied by a tbabs spectral model to take into account the absorption of soft X-rays by interstellar matter with abundance taken from Wilms et al. (2000) and the photoelectric cross sections from Verner et al. (1996). Residuals left in the form of absorption were fitted with a Gaussian absorption profile, and this could be interpreted as CRSF. The CRSF line was present at 51 ± 1 keV, with a large optical depth of  . Addition of the CRSF improved the fit significantly and reduced the χ2(d.o.f.) from 880 (459) to 481 (456). This strong absorption feature was prominent in the raw spectrum as well. The residuals between spectral model and data are shown in Fig. 4, with the cyclotron line optical depth set to zero. The significance of the CRSF feature was calculated by making 100 000 simulations of the data using the XSPEC tool simftest. In each of the data simulations, spectral models were fitted with and without the absorption feature and the corresponding best-fit χ2 values were calculated. The false-detection probability was then calculated to be less than 10−5. The fluorescent iron Kα line present in the spectrum was modelled using a Gaussian emission-line feature at ∼6.3 keV with an equivalent width of
  eV. This emission feature was quite significant with a false detection probability of 10−4 calculated from 10 000 simulations in the simftest tool. Power-law continuum with multiple cutoff models, such as highEcut, highEcut with a smoothing absorption feature, and newhcut (Burderi et al. 2000), as well as NPEX (Makishima et al. 1999), describe the continuum well. All models show residuals in high energy around 50 keV. The newhcut model was finally chosen as it yields the lowest χ2 in the fitting.
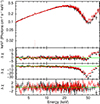 |
Fig. 4. Spectrum and best-fit spectral model for ObsID 02. The top panel consists of the best-fit model along with the different components. The second panel from the top shows the residual from the best-fit model without the addition of a cyclotron line. The third panel from the top corresponds to the residual obtained by setting the strength of the CRSF to zero. The bottom panel corresponds to the best-fit model residuals. The black points correspond to FPMA, while the red points are for FPMB. |
The final spectral model used was tbabs × (powerlaw × newhcut + Gaussian) × gabs. The power-law component has a photon index of 1.29 ± 0.01, which is similar to those obtained from earlier XMM-Newton (Reig & Zezas 2018) and Chandra (Tomsick et al. 2006) observations. The best-fit spectral model in E2dN/dE (top panel) as well as the residuals for the best-fit spectrum (bottom panel) are given in Fig. 4. The best-fit spectral parameters are given in Table 1 with errors at a 90% confidence interval.
The best-fit spectral parameters of the IGR J0607.4+2205 for both observations.
A similar continuum model as of ObsID 02 was used for ObsID 04. There was a soft excess present in the spectrum of ObsID 04, which was modelled with a black body component. Addition of the black body component decreases the χ2(d.o.f.) from 446.58 (244) to 255.55 (242). The absorption column density cannot be constrained and was therefore fixed at a value of 0.43 × 10²² atoms cm−2, which corresponds to the Galactic absorption component along the line-of-sight (Kalberla et al. 2005; HI4PI Collaboration 2016). The final spectral model of tbabs × (powerlaw × newhcut + bbodyrad) gave a χ2 of 256 for 242 degrees of freedom (d.o.f.). The temperature of the black body component was found to be 1.18 ± 0.03 keV, originating from an area of radius 0.17 ± 0.01 km. The high temperature and small radius of the thermal component indicate that it probably originates from the accretion mound near the magnetic poles of the NS. The best-fit spectra and residuals are given in Fig. 5. In ObsID 04, the spectrum has very poor statistical significance above 40 keV, limiting the possibility for detection of a CRSF. As we are aware of the presence of a CRSF in the source for ObsID 02 at ∼51 keV, we added a Gaussian absorption component to the spectrum, with the line centre and width set to the best-fit values from ObsID 02. Nevertheless, the introduction of this extra component does not result in any enhancement in the χ2, yielding an upper limit on the optical depth of 0.68 at a 90% confidence level. The best-fit spectral parameters are provided in Table 1.
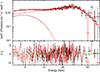 |
Fig. 5. Spectrum and best-fit spectral model for ObsID 04. The top panel consists of the best-fit models along with the different components. The bottom panel corresponds to the best-fit model residuals. The black points correspond to FPMA, while the red points are for FPMB. |
Subsequently, as we know there is a black body component from ObsID 04, we tried to add a similar black body component to ObsID 02. The temperature of the black body component cannot be constrained, and so it was frozen to the temperature from ObsID 04. The addition of the extra component leads to no significant decrease in χ2, yielding an upper limit on the luminosity of the black body component of ∼1034 erg s−1 at the 90% confidence level. The luminosity of the source was calculated assuming a distance of 4.5 kpc (Reig et al. 2010).
4. Discussion
IGR J0607.4+2205 underwent an outburst in October 2023. Two TOO observations were performed with NuSTAR, capturing the source during an outburst for the first time. In this work, we report the results from the two NuSTAR observations of IGR J0607.4+2205 during the 2023 outburst of the source.
Assuming a distance of 4.5 kpc (Reig et al. 2010), the source luminosity in the 3−78 keV range underwent a substantial change from 3.04 × 1036 erg s−1 in ObsID 02 to 2.09 × 1035 erg s−1 in ObsID 04. The period of pulsation obtained with NuSTAR is consistent with the spin frequency observed in the XMM-Newton observation, indicating no significant long-term slow down of the pulsar (Reig & Zezas 2018). The persistent pulsations present during ObsID 04 suggest disc accretion of matter onto the NS. The pulse profile of IGR J0607.4+2205 is double-humped in nature with a high pulse fraction (≥50%). The source exhibits significant changes in pulse shape during the outburst. Luminosity-dependent changes in pulse profile have been observed in many X-ray pulsars (e.g. Parmar et al. 1989; Doroshenko et al. 2017; Sharma et al. 2023). The low-energy (≤20 keV) pulse shape of IGR J0607.4+2205 is significantly different between the two observations, while the higher energy (20−40 keV) pulse profile remains consistent. Similar behaviour has been reported for RX J0529.8−6556 (Treiber et al. 2021), where a misaligned Be disc is proposed to explain the observed changes in the pulse shape.
We modelled the broadband spectrum of the source with a cutoff power-law model as expected for HMXBs (White et al. 1983). The hard X-ray spectrum of the source is dominated by a strong non-thermal (power-law) component with a high-energy cutoff during ObsID 02. We observe a CRSF for the first time in the spectrum of IGR J0607.4+2205, as expected from a highly magnetised BeXRP. The cyclotron line was detected at a very high energy of  keV. From the CRSF centroid energy, we calculated the strength of the magnetic field to be 4.4 ± 0.1 × 10¹² G. We also report the first ever detection of iron Kα fluorescent emission from IGR J0607.4+2205 with an equivalent width of
  eV. During ObsID 04, the source flux reduced by a factor of about 15. A significant change in the spectral properties was observed and no CRSF feature can be constrained, which is possibly due to poor statistics. An additional thermal (black-body) component at a temperature ∼1 keV originating from a radius of ∼170 m was present during ObsID 04. The parameters of the black-body are consistent with thermal emissions from a hot spot on the surface of the NS.
Spectral parameters have been seen to evolve significantly in BeXRBs during outbursts (e.g. Reig & Nespoli 2013; Lutovinov et al. 2021; Mandal et al. 2023). The correlation between the spectral slope and the source luminosity has been found to change at a critical luminosity, signifying an alteration in the emission mechanism and beaming pattern of the source (Becker et al. 2012). From the CRSF Becker et al. (2012), the critical luminosity of IGR J0607.4+2205 was calculated to be about 7 × 1037 erg s−1, which is much higher than the observed luminosity during ObsID 02. This suggests that the source was well below the critical luminosity. The luminosity during ObsID 04 dropped to ∼2 × 1035 erg s−1, where accretion onto the NS surface is near free fall and radiation is dominated by the hot spot or mounds near the NS polar caps (Mushtukov et al. 2021).
The discovery of a CRSF in a new source is crucial for determining the magnetic field strength near the NS surface and advancing our understanding of accretion processes near the surface of the NS. The accretion torque acting on an NS due to mass accretion depends on its mass-accretion rate, spin period, and magnetic field. Knowledge of the magnetic field strength is therefore crucial in order to corroborate the accretion torque models. Of the hundreds of X-ray binary pulsars, around 50 or so sources exhibit a CRSF (Staubert et al. 2019; Devaraj & Paul 2022). The centroid energy of the CRSF detected in IGR J0607.4+2205 is relatively high among sources in which a CRSF has been detected. Additional broadband observations of IGR J0607.4+2205 are needed to study the luminosity dependence of the pulse profile and the CRSF.
Acknowledgments
We thank the referee for the useful comments that improved the quality of this paper. K.R. would like to thank Ashwin Devaraj for his valuable inputs during the preparation of the manuscript for this project. This research made use of data obtained with NuSTAR, a project led by Caltech, funded by NASA and managed by NASA/JPL.
References
- Arnaud, K. A. 1996, ASP Conf. Ser., 101, 17 [Google Scholar]
- Becker, P. A., & Wolff, M. T. 2007, ApJ, 654, 435 [NASA ADS] [CrossRef] [Google Scholar]
- Becker, P. A., Klochkov, D., Schönherr, G., et al. 2012, A&A, 544, A123 [NASA ADS] [CrossRef] [EDP Sciences] [Google Scholar]
- Burderi, L., Di Salvo, T., Robba, N. R., La Barbera, A., & Guainazzi, M. 2000, ApJ, 530, 429 [NASA ADS] [CrossRef] [Google Scholar]
- Chenevez, J., Budtz-Jorgensen, C., Lund, N., et al. 2004, ATel, 223, 1 [NASA ADS] [Google Scholar]
- Devaraj, A., & Paul, B. 2022, MNRAS, 514, L46 [NASA ADS] [Google Scholar]
- Doroshenko, V., Tsygankov, S. S., Mushtukov, A. A., et al. 2017, MNRAS, 466, 2143 [NASA ADS] [CrossRef] [Google Scholar]
- Harrison, F. A., Craig, W. W., Christensen, F. E., et al. 2013, ApJ, 770, 103 [Google Scholar]
- HI4PI Collaboration (Ben Bekhti, N., et al.) 2016, A&A, 594, A116 [NASA ADS] [CrossRef] [EDP Sciences] [Google Scholar]
- Kaastra, J. S., & Bleeker, J. A. M. 2016, A&A, 587, A151 [NASA ADS] [CrossRef] [EDP Sciences] [Google Scholar]
- Kalberla, P. M. W., Burton, W. B., Hartmann, D., et al. 2005, A&A, 440, 775 [NASA ADS] [CrossRef] [EDP Sciences] [Google Scholar]
- Krimm, H. A., Holland, S. T., Corbet, R. H. D., et al. 2013, ApJS, 209, 14 [NASA ADS] [CrossRef] [Google Scholar]
- Levine, A. M., Bradt, H., Cui, W., et al. 1996, ApJ, 469, L33 [NASA ADS] [CrossRef] [Google Scholar]
- Lutovinov, A., Tsygankov, S., Molkov, S., et al. 2021, ApJ, 912, 17 [Google Scholar]
- Madsen, K. K., Harrison, F. A., Markwardt, C. B., et al. 2015, ApJS, 220, 8 [Google Scholar]
- Makishima, K., Mihara, T., Nagase, F., & Tanaka, Y. 1999, ApJ, 525, 978 [NASA ADS] [CrossRef] [Google Scholar]
- Malacaria, C., Jenke, P., Roberts, O. J., et al. 2020, ApJ, 896, 90 [NASA ADS] [CrossRef] [Google Scholar]
- Malacaria, C., Jenke, P., & Wilson-Hodge, C. A. 2023, ATel, 16307, 1 [NASA ADS] [Google Scholar]
- Mandal, M., Sharma, R., Pal, S., et al. 2023, MNRAS, 526, 771 [NASA ADS] [CrossRef] [Google Scholar]
- Matsuoka, M., Kawasaki, K., Ueno, S., et al. 2009, PASJ, 61, 999 [Google Scholar]
- Meszaros, P. 1992, High-energy Radiation from Magnetized Neutron Stars (Chicago: University of Chicago Press) [Google Scholar]
- Mihara, T., Nakajima, M., Negoro, H., et al. 2023, ATel, 16351, 1 [NASA ADS] [Google Scholar]
- Mushtukov, A. A., Suleimanov, V. F., Tsygankov, S. S., & Portegies Zwart, S. 2021, MNRAS, 503, 5193 [Google Scholar]
- Parmar, A. N., White, N. E., & Stella, L. 1989, ApJ, 338, 373 [NASA ADS] [CrossRef] [Google Scholar]
- Reig, P., & Nespoli, E. 2013, A&A, 551, A1 [NASA ADS] [CrossRef] [EDP Sciences] [Google Scholar]
- Reig, P., & Zezas, A. 2018, A&A, 613, A52 [NASA ADS] [CrossRef] [EDP Sciences] [Google Scholar]
- Reig, P., Zezas, A., & Gkouvelis, L. 2010, A&A, 522, A107 [NASA ADS] [CrossRef] [EDP Sciences] [Google Scholar]
- Sharma, R., Jain, C., & Paul, B. 2023, MNRAS, 526, L35 [NASA ADS] [CrossRef] [Google Scholar]
- Staubert, R., Trümper, J., Kendziorra, E., et al. 2019, A&A, 622, A61 [NASA ADS] [CrossRef] [EDP Sciences] [Google Scholar]
- Tomsick, J. A., Chaty, S., Rodriguez, J., Walter, R., & Kaaret, P. 2006, ATel, 959, 1 [NASA ADS] [Google Scholar]
- Treiber, H., Vasilopoulos, G., Bailyn, C. D., et al. 2021, MNRAS, 503, 6187 [CrossRef] [Google Scholar]
- Tsygankov, S. S., Wijnands, R., Lutovinov, A. A., Degenaar, N., & Poutanen, J. 2017, MNRAS, 470, 126 [Google Scholar]
- Verner, D. A., Ferland, G. J., Korista, K. T., & Yakovlev, D. G. 1996, ApJ, 465, 487 [Google Scholar]
- White, N. E., Swank, J. H., & Holt, S. S. 1983, ApJ, 270, 711 [NASA ADS] [CrossRef] [Google Scholar]
- Wilms, J., Allen, A., & McCray, R. 2000, ApJ, 542, 914 [Google Scholar]
All Tables
All Figures
|
Fig. 1. Long-term light curve from MAXI/GSC (in blue) and Swift/BAT (in red) plotted with a bin size of 1 day and 5 days, respectively. The green line denotes the epoch and duration of the first observation, while the second observation is shown in orange. |
| In the text | |
|
Fig. 2. Normalised pulse profiles of combined FPMA and FPMB light curves from ObsID 02 (black) and ObsID 04 (red). The top panel consists of the pulse profile in the energy range of 3−78 keV. The remaining panels show the energy-resolved profiles in the energy ranges of 3−7, 7−10, 10−20, 20−40, 40−60, and 60−78 keV, respectively. |
| In the text | |
|
Fig. 3. Variation of the pulsed fraction with energy for the two NuSTAR observations ObsID 02 (in black) and ObsID 04 (in red). |
| In the text | |
|
Fig. 4. Spectrum and best-fit spectral model for ObsID 02. The top panel consists of the best-fit model along with the different components. The second panel from the top shows the residual from the best-fit model without the addition of a cyclotron line. The third panel from the top corresponds to the residual obtained by setting the strength of the CRSF to zero. The bottom panel corresponds to the best-fit model residuals. The black points correspond to FPMA, while the red points are for FPMB. |
| In the text | |
|
Fig. 5. Spectrum and best-fit spectral model for ObsID 04. The top panel consists of the best-fit models along with the different components. The bottom panel corresponds to the best-fit model residuals. The black points correspond to FPMA, while the red points are for FPMB. |
| In the text | |
Current usage metrics show cumulative count of Article Views (full-text article views including HTML views, PDF and ePub downloads, according to the available data) and Abstracts Views on Vision4Press platform.
Data correspond to usage on the plateform after 2015. The current usage metrics is available 48-96 hours after online publication and is updated daily on week days.
Initial download of the metrics may take a while.