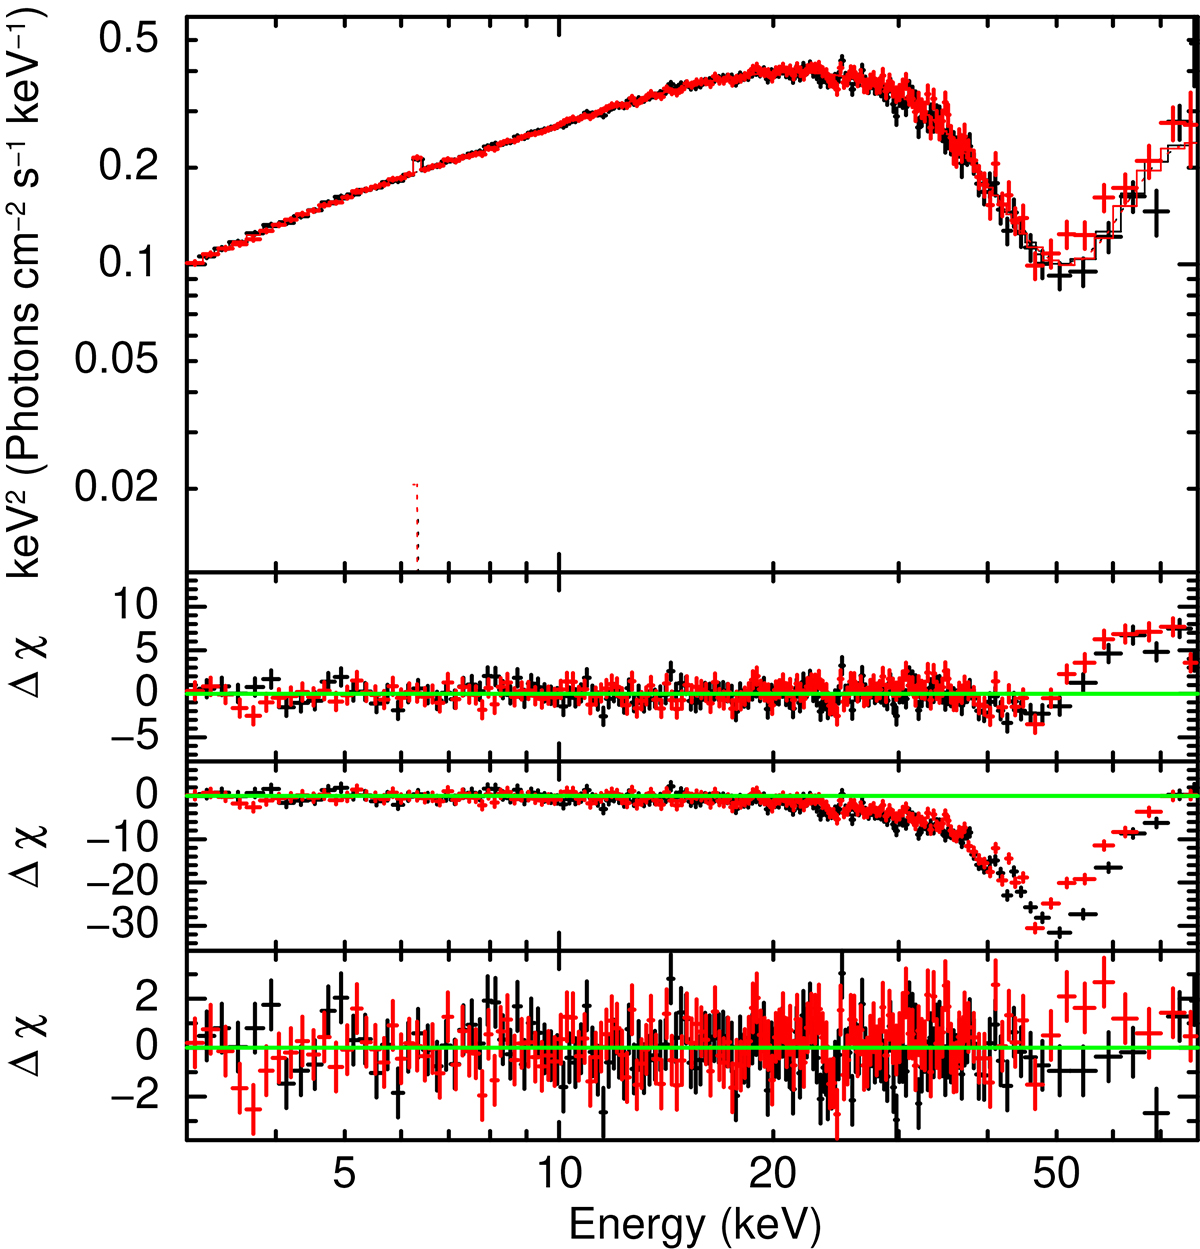
Fig. 4.
Download original image
Spectrum and best-fit spectral model for ObsID 02. The top panel consists of the best-fit model along with the different components. The second panel from the top shows the residual from the best-fit model without the addition of a cyclotron line. The third panel from the top corresponds to the residual obtained by setting the strength of the CRSF to zero. The bottom panel corresponds to the best-fit model residuals. The black points correspond to FPMA, while the red points are for FPMB.
Current usage metrics show cumulative count of Article Views (full-text article views including HTML views, PDF and ePub downloads, according to the available data) and Abstracts Views on Vision4Press platform.
Data correspond to usage on the plateform after 2015. The current usage metrics is available 48-96 hours after online publication and is updated daily on week days.
Initial download of the metrics may take a while.