Fig. 3
Download original image
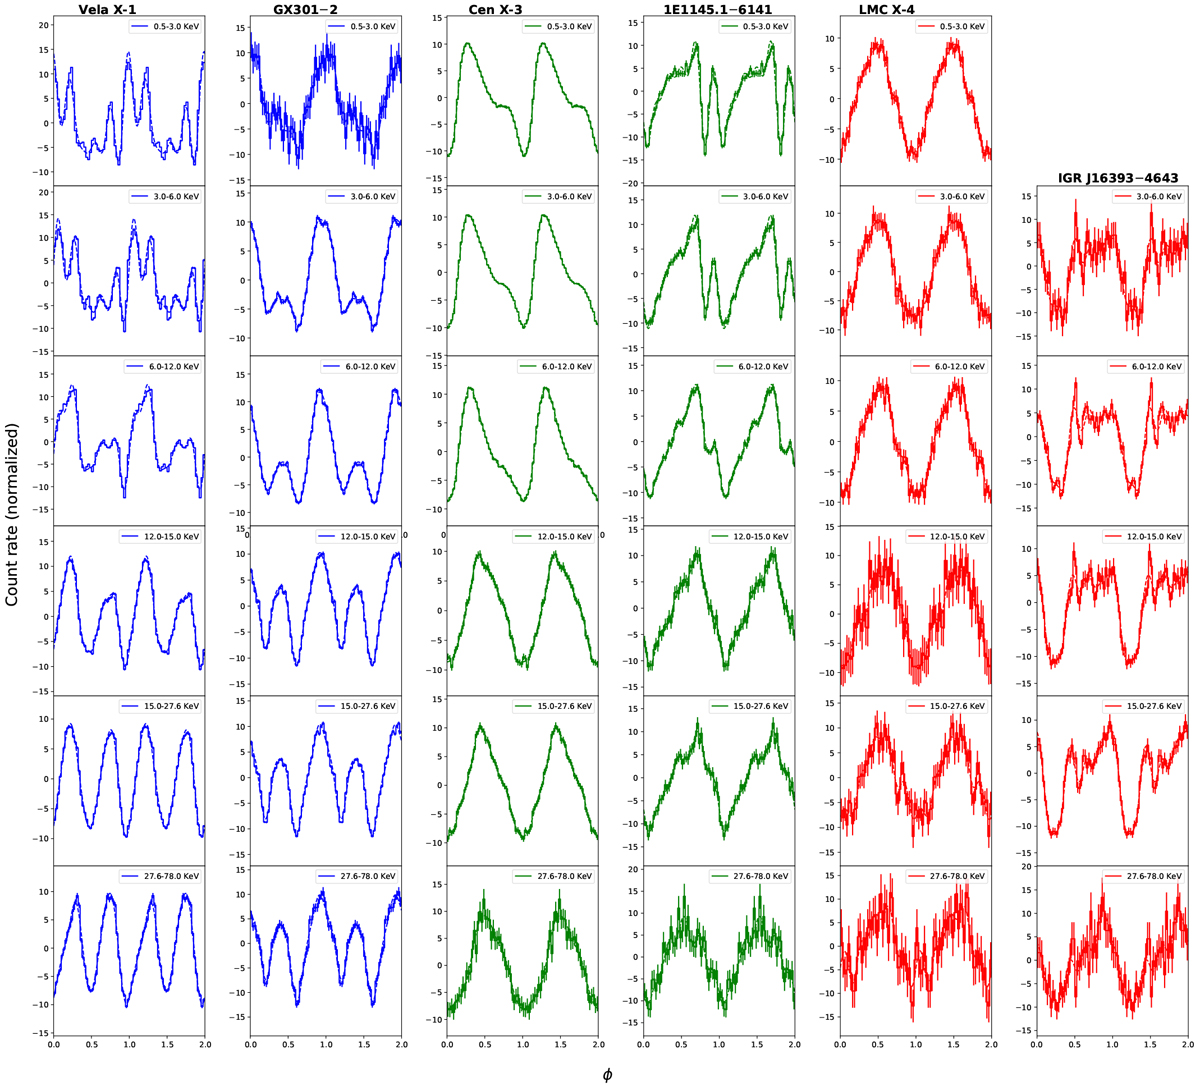
Comparison of the normalized pulse profiles of different sources of the sample studied at different energy ranges. The sources are in order from left to right: Vela X–l (type 2), GX 301 – 2 (type 2), CenX–3 (type 1), 1E1145.1–6141 (type 1), LMC X–4 (typeO), and IGR J16393–4643 (type 0). The measured profiles are represented by solid lines, whereas the Fourier fits are represented by dashed lines. The boundaries of the energy ranges are [0.5, 3, 6, 12, 15, 27.6, and 78] keV. The pulse profiles were phase shifted by hand to align the maximums of the pulse profiles of two observations (in cases with observations of both telescopes) and coloured according to their respective pulse profile types in order to better show a comparison between them.
Current usage metrics show cumulative count of Article Views (full-text article views including HTML views, PDF and ePub downloads, according to the available data) and Abstracts Views on Vision4Press platform.
Data correspond to usage on the plateform after 2015. The current usage metrics is available 48-96 hours after online publication and is updated daily on week days.
Initial download of the metrics may take a while.