Fig. 7
Download original image
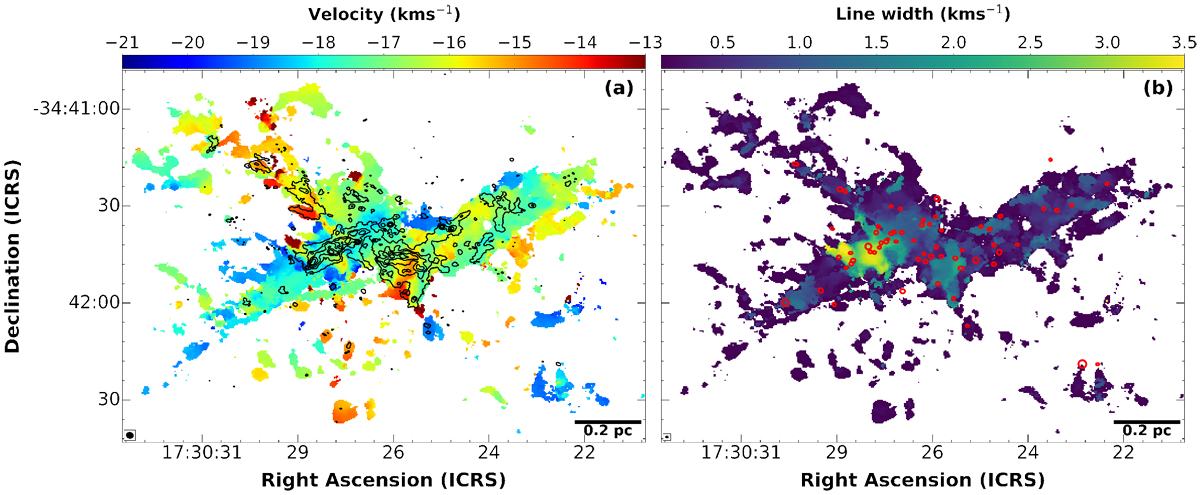
Network of filaments, which interact at the center of the G353.41 protocluster. First-moment (panel a) and second-moment (panel b) 12 m array images of the N2H+ (1-0) isolated hyperfine satellite, corresponding to the centroid velocity and line width, respectively. The 1.3 mm continuum emission is overlaid in (a) in black contours, which are 4, 20, 40, 80, and 160 in units of σ = 0.3 mJy beam−1. Red ellipses in b denote the ALMA-IMF core locations. Ellipses in the lower-left corners represent the angular resolutions of the N2H+ (1–0) in a and 1.3 mm continuum images in b.
Current usage metrics show cumulative count of Article Views (full-text article views including HTML views, PDF and ePub downloads, according to the available data) and Abstracts Views on Vision4Press platform.
Data correspond to usage on the plateform after 2015. The current usage metrics is available 48-96 hours after online publication and is updated daily on week days.
Initial download of the metrics may take a while.