Fig. 3
Download original image
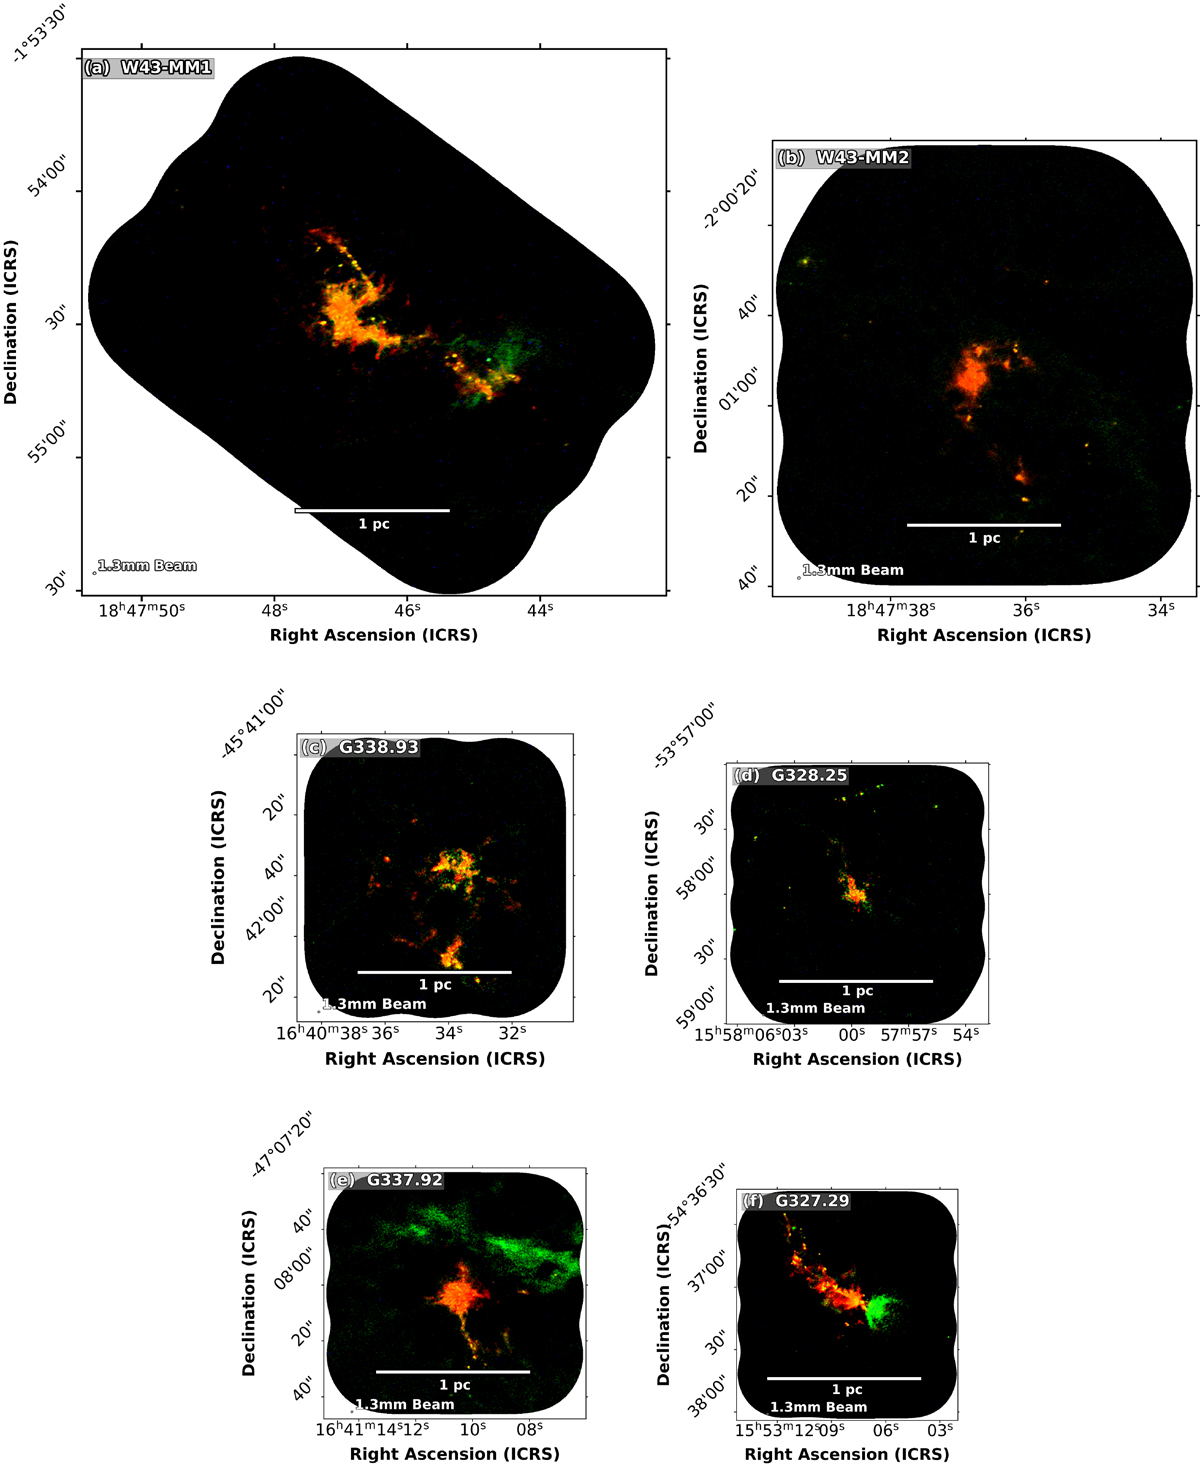
Three-color ALMA 12 m array images of the Young clouds: W43-MM1 (panel a), W43-MM2 (panel b), G338.93 (panel c), G328.25 (panel d), G337.92 (panel e), and G327.29 (panel f), plotted at the same physical scale. Red and green display the continuum images at 1.3 and 3 mm, respectively, with the green color for the longer, 3 mm, wavelength because the 3 mm emission is partly associated with hot ionized gas. Blue corresponds to the free-free emission at the frequency of the H41α recombination line. Thermal dust emission of filaments and cores is shown in orange shades, while diffuse green features locate weak free-free emission from faint H II regions in e and f.
Current usage metrics show cumulative count of Article Views (full-text article views including HTML views, PDF and ePub downloads, according to the available data) and Abstracts Views on Vision4Press platform.
Data correspond to usage on the plateform after 2015. The current usage metrics is available 48-96 hours after online publication and is updated daily on week days.
Initial download of the metrics may take a while.