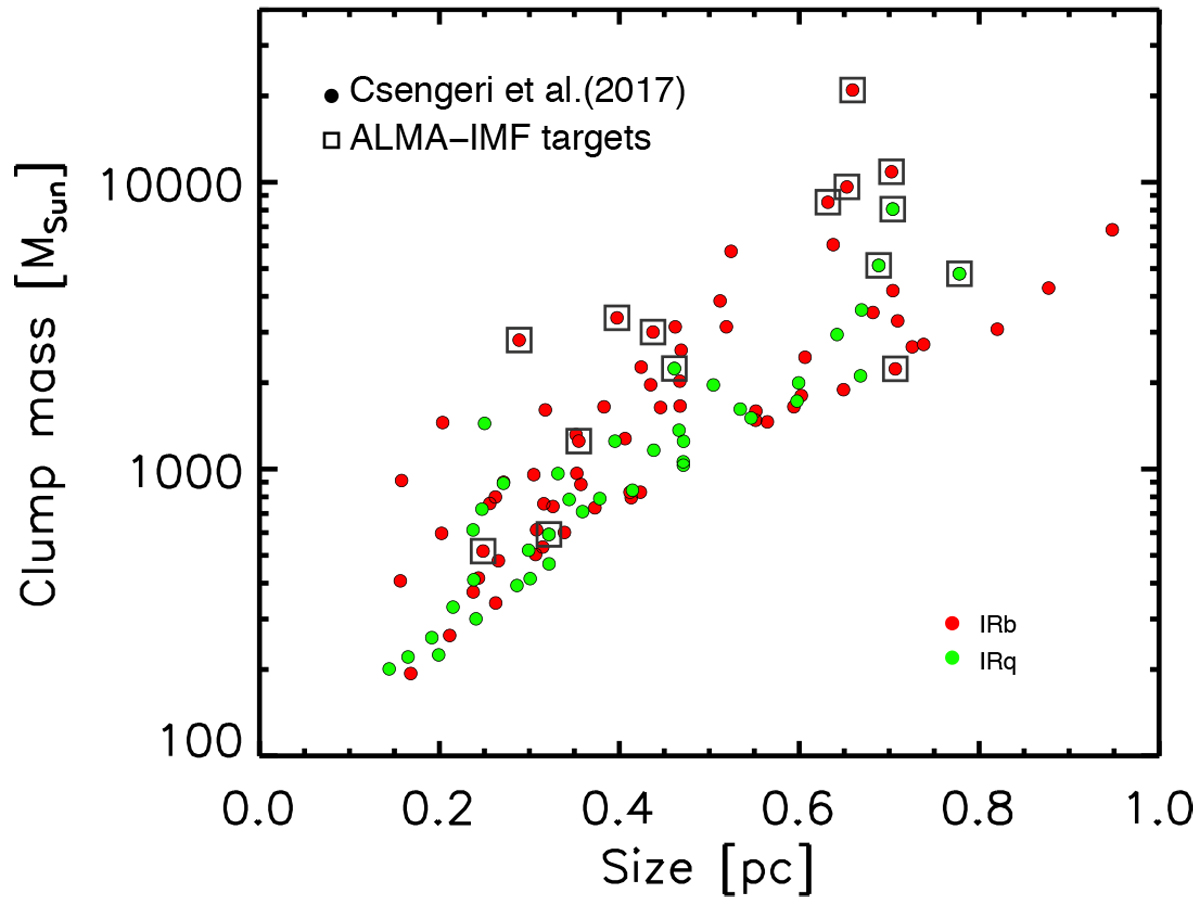
Fig. A.1
Download original image
Mass versus size distribution of the ATLASGAL clumps selected for the ALMA-IMF survey (highlighted with squares; see Fig. 1), compared to the rest of the Csengeri et al. (2017) sample at distances between 1 kpc and 5.5 kpc. ATLASGAL clumps targeted by ALMA-IMF are among the brightest and most concentrated. For more details on the selection criteria, see Sect. 2.
Current usage metrics show cumulative count of Article Views (full-text article views including HTML views, PDF and ePub downloads, according to the available data) and Abstracts Views on Vision4Press platform.
Data correspond to usage on the plateform after 2015. The current usage metrics is available 48-96 hours after online publication and is updated daily on week days.
Initial download of the metrics may take a while.