Fig. 3
Download original image
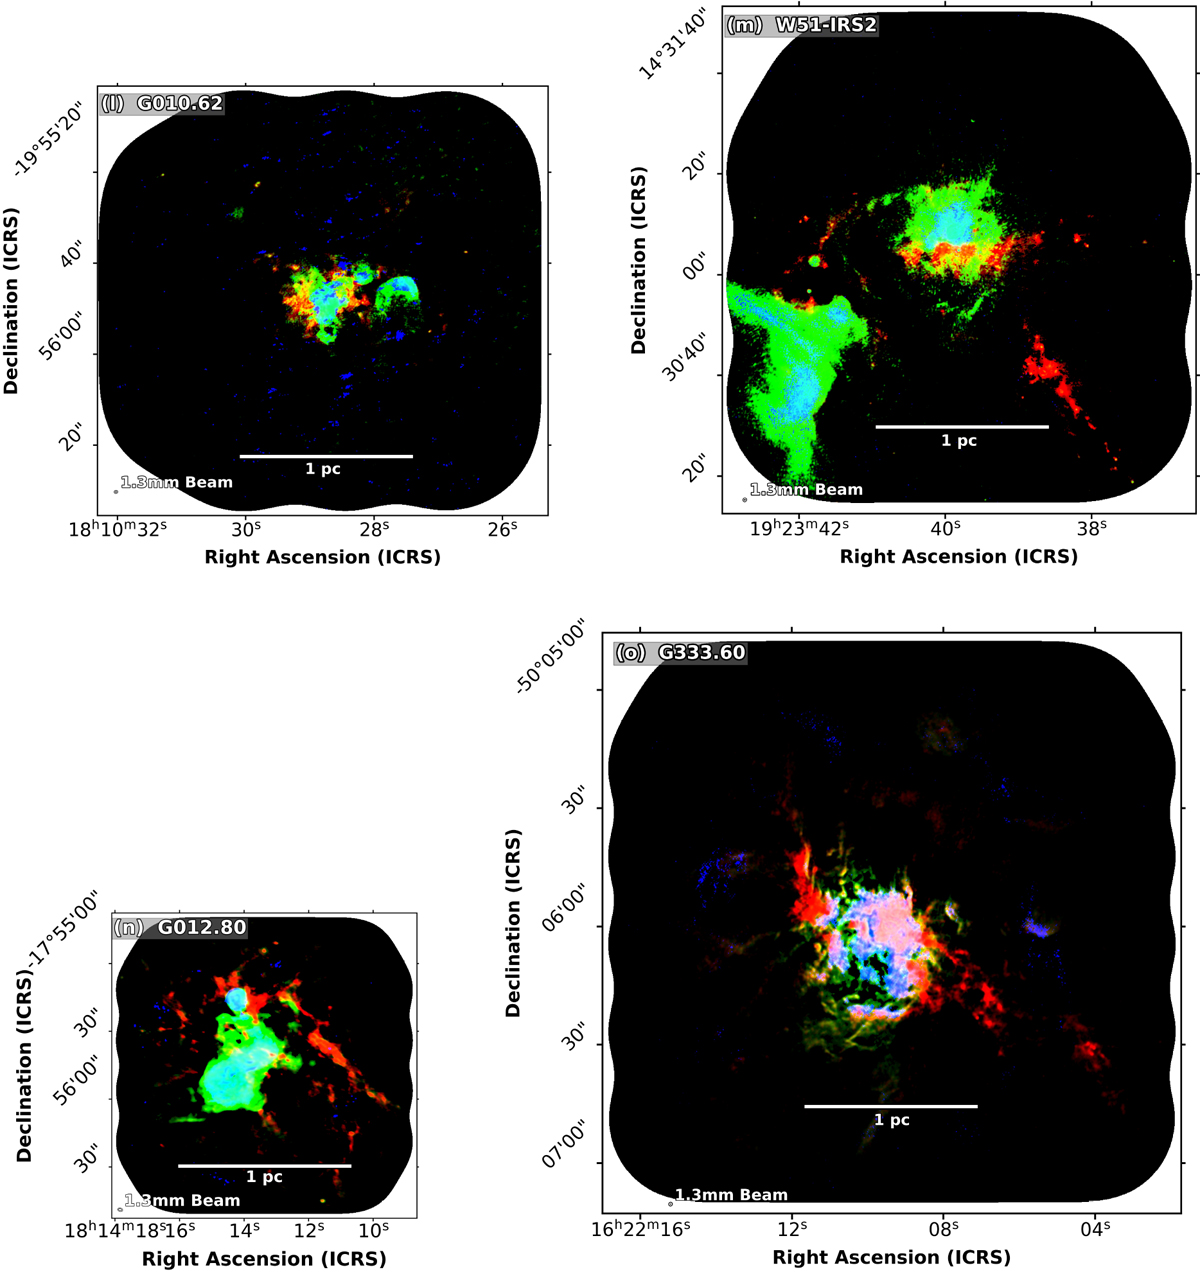
(Continued) Three-color ALMA 12 m array images of the Evolved clouds: G010.62 (panel l), W51-IRS2 (panel m), G012.80 (panel n), and G333.60 (panel o). There is an almost complete coincidence between the free-free emission at the H41α recombination line frequency (blue) and the 3 mm continuum (green), which is dominated in panels l-o by free-free emission. Red filamentary structures represent the few locations where thermal dust emission dominates the continuum millimeter emission.
Current usage metrics show cumulative count of Article Views (full-text article views including HTML views, PDF and ePub downloads, according to the available data) and Abstracts Views on Vision4Press platform.
Data correspond to usage on the plateform after 2015. The current usage metrics is available 48-96 hours after online publication and is updated daily on week days.
Initial download of the metrics may take a while.