Fig. 1
Download original image
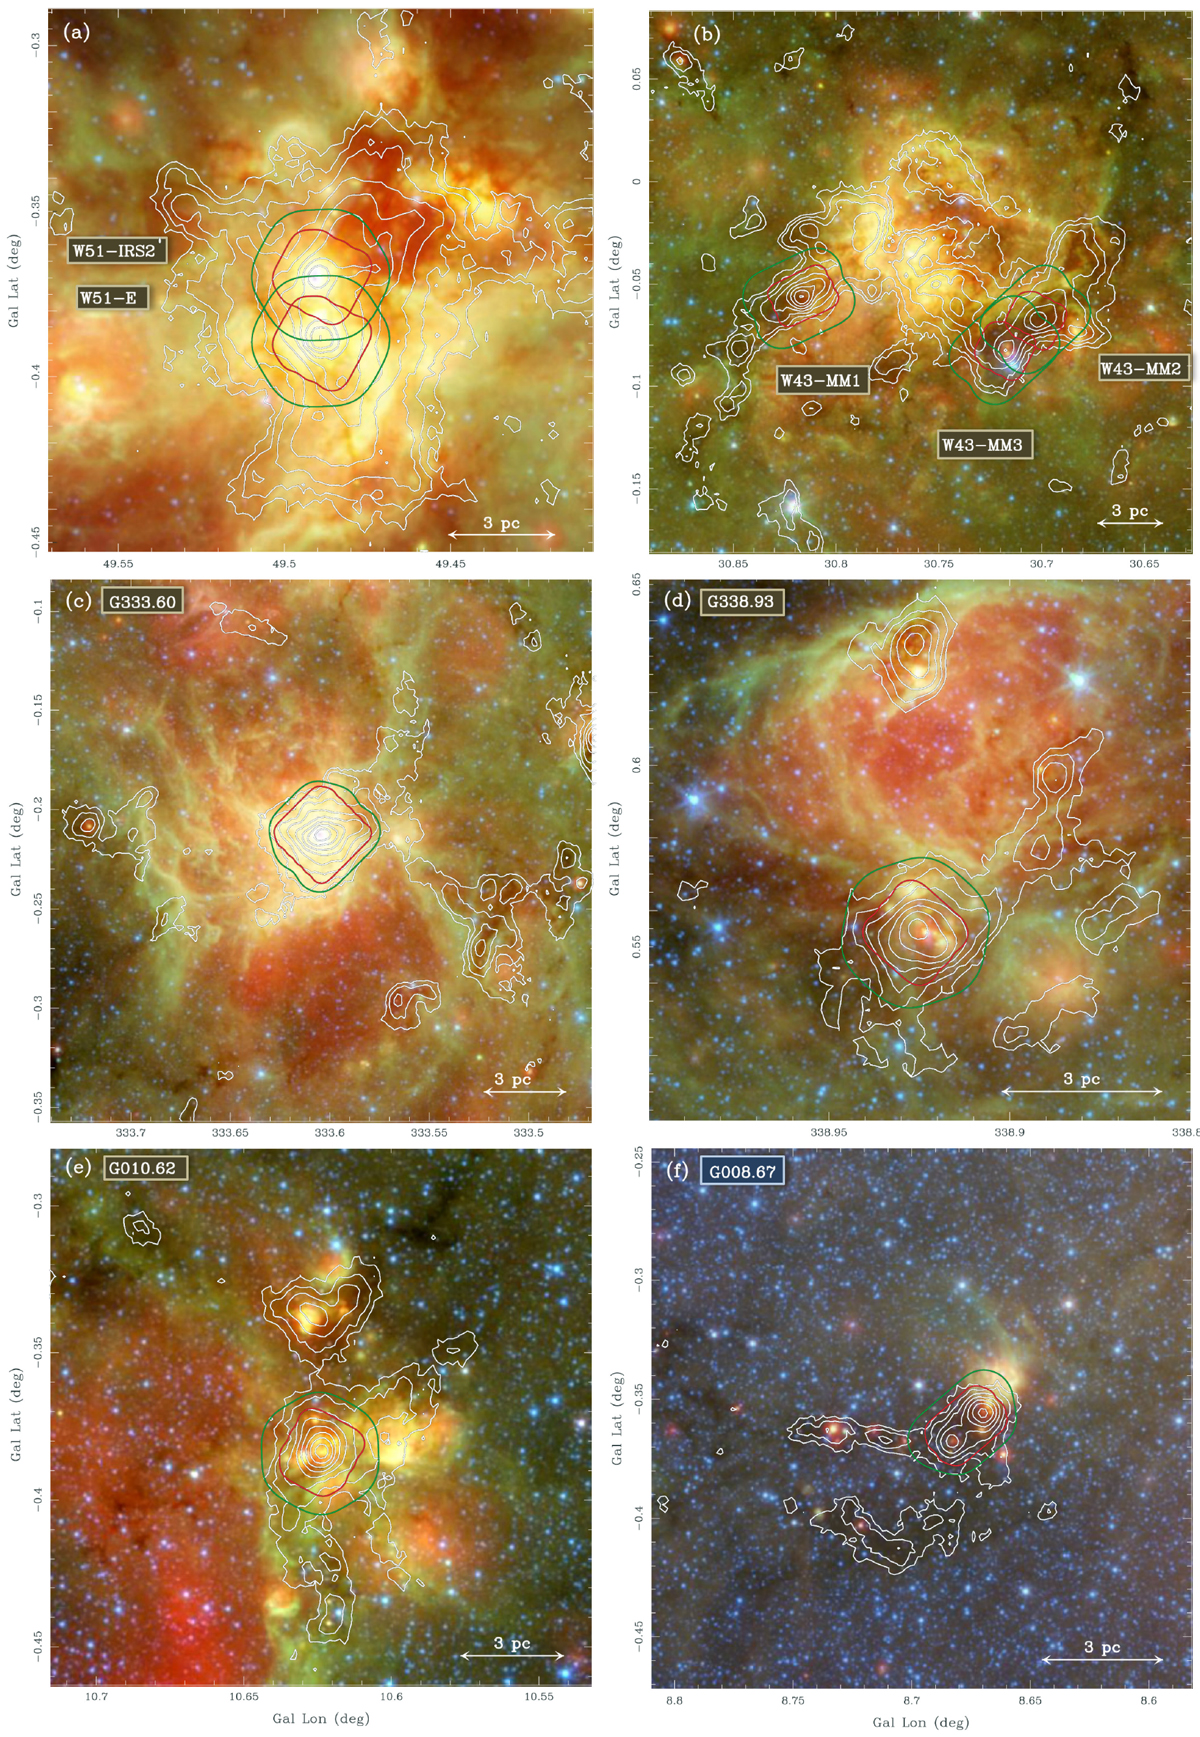
Overview of the surroundings of the ALMA-IMF protocluster clouds, ordered by decreasing mass of their central clump (Col. (9) of Table 1): W51-E and W51-IRS2 (panel a), W43-MM1, W43-MM2, and W43-MM3 (panel b), G333.60 (panel c), G338.93 (panel d), G010.62 (panel e), and G008.67 (panel f). ATLASGAL 870 μm emission contours (logarithmically spaced from 0.45 Jy beam−1 to 140 Jy beam−1 with a 19.2″ beam) are overlaid on Spitzer three-color images (red represents MIPS 24 μm, green GLIMPSE 8 μm, and blue GLIMPSE 3.6 μm). The green and red contours outline the primary beam response of the ALMA 12 m array mosaics down to 15% at 3 mm and 1.3 mm, respectively. A 3 pc scale bar is shown in the lower-right corner of each image.
Current usage metrics show cumulative count of Article Views (full-text article views including HTML views, PDF and ePub downloads, according to the available data) and Abstracts Views on Vision4Press platform.
Data correspond to usage on the plateform after 2015. The current usage metrics is available 48-96 hours after online publication and is updated daily on week days.
Initial download of the metrics may take a while.