Fig. 9.
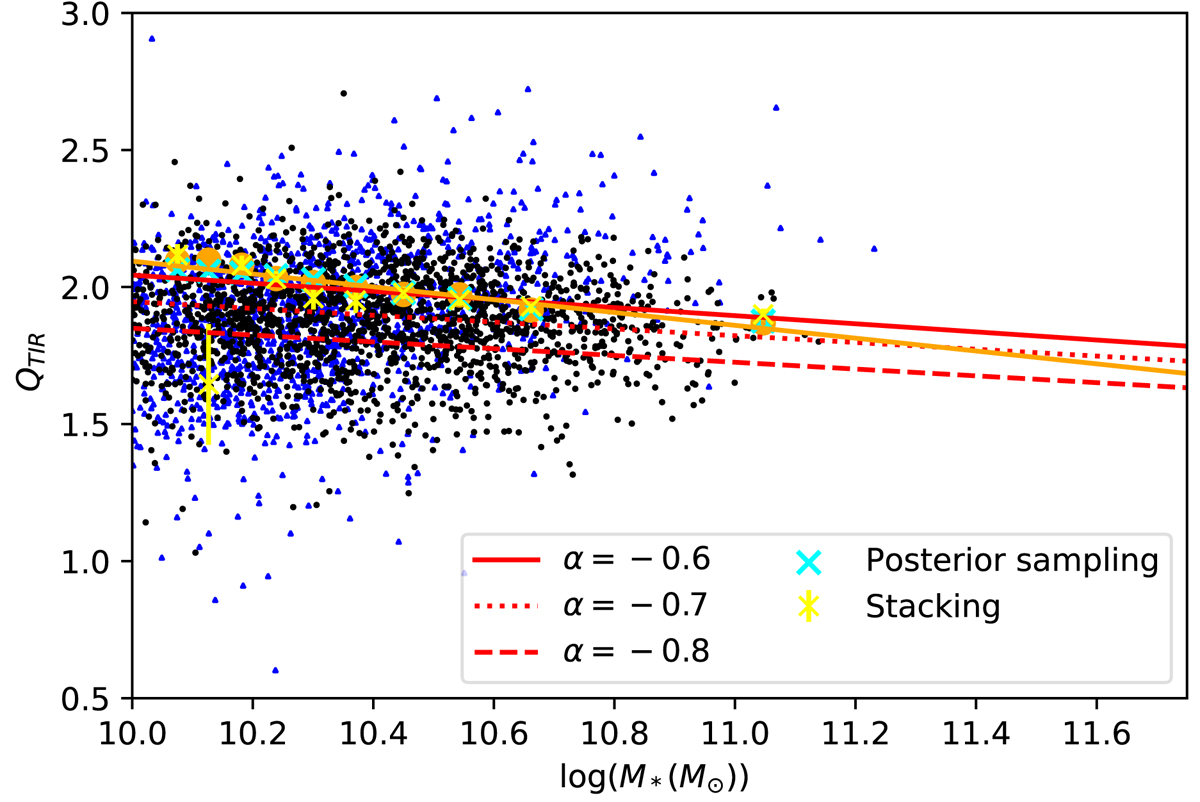
Download original image
Variation of the FIRC at 150 MHz with stellar mass for our mass sample. The blue points are upper limits of radio luminosity (lower limit on q) and the black points are for direct detections. The orange points are the median qTIR measured using survival analysis in each stellar mass bin and the orange line is the linear fit to those points. The light blue crosses are the median qTIR within each bin measured using the method described in Smith et al. (2021), while the yellow points are the median qTIRs measured with stacking. The red lines are the linear fit from Eq. (6) of Delvecchio et al. (2021) at the median redshift of our sample converted to 150 MHz with three spectral indices (see legend).
Current usage metrics show cumulative count of Article Views (full-text article views including HTML views, PDF and ePub downloads, according to the available data) and Abstracts Views on Vision4Press platform.
Data correspond to usage on the plateform after 2015. The current usage metrics is available 48-96 hours after online publication and is updated daily on week days.
Initial download of the metrics may take a while.