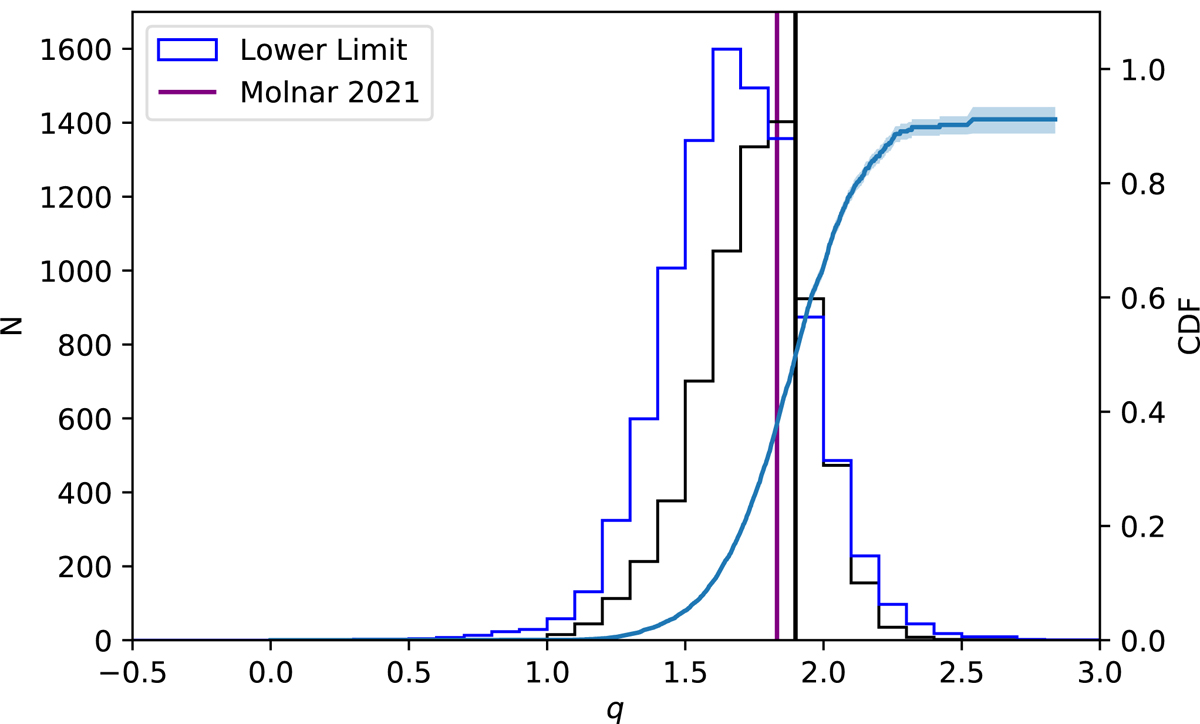
Fig. 7.
Download original image
Distribution of qTIR values for the redshift sample with M* > 1010.2 and z< 1. The black histogram is the qTIR distribution for galaxies that are detected at 150MHz. The blue histogram is the distribution of lower limits of qTIR for galaxies that have an upper limit at 150MHz and therefore their qTIR is a lower limit. The vertical line marks the median of the sample, as measured using survival analysis and the purple line shows the median qTIR from Molnár et al. (2021), measured at 1.4 GHz and converted to 150MHz using α = −0.78
Current usage metrics show cumulative count of Article Views (full-text article views including HTML views, PDF and ePub downloads, according to the available data) and Abstracts Views on Vision4Press platform.
Data correspond to usage on the plateform after 2015. The current usage metrics is available 48-96 hours after online publication and is updated daily on week days.
Initial download of the metrics may take a while.