Fig. 4.
Download original image
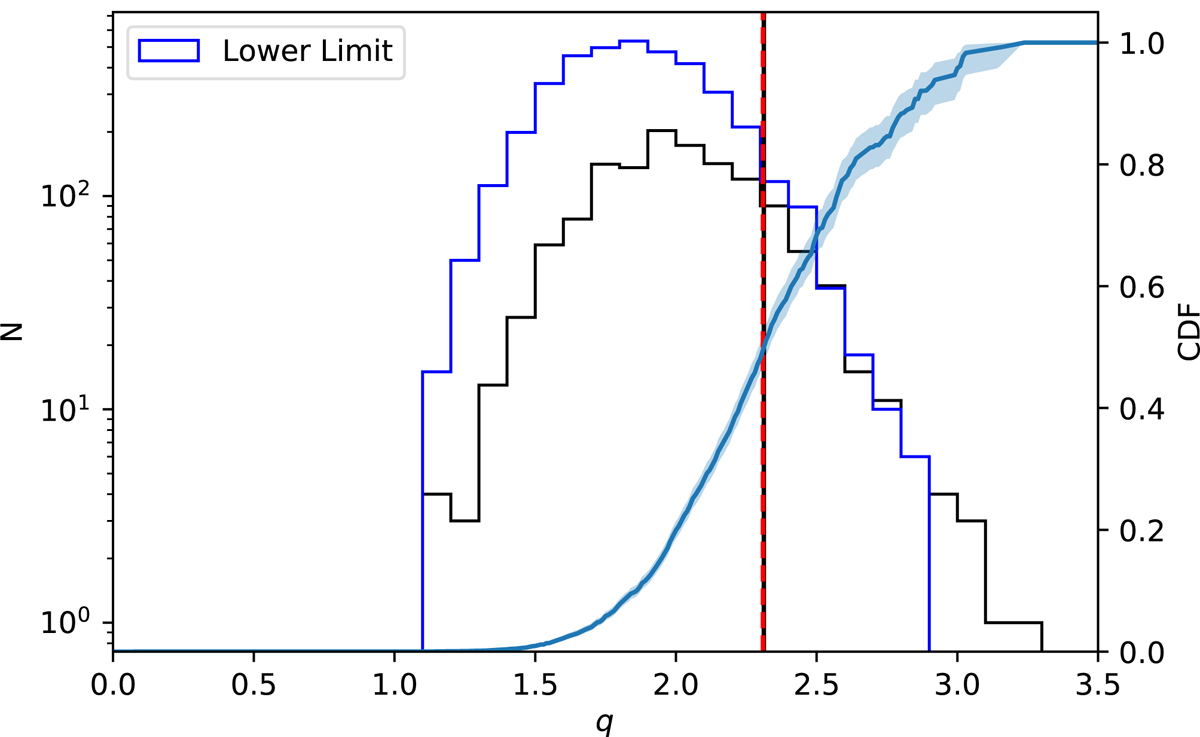
Distribution of qTIR values from the SIDES simulation for galaxies with M* > 1010.45 and z < 1. The blue histogram is for lower limits of qTIR and the black histogram is for direct detections. The black vertical line (behind the dashed red line) marks the median of the sample, as measured using survival analysis and the red dashed vertical line shows the true median. The slight overestimation of the median is caused by the greater number of lower limits compared to direct detections. The blue line is the CDF of the entire sample, measured using survival analysis.
Current usage metrics show cumulative count of Article Views (full-text article views including HTML views, PDF and ePub downloads, according to the available data) and Abstracts Views on Vision4Press platform.
Data correspond to usage on the plateform after 2015. The current usage metrics is available 48-96 hours after online publication and is updated daily on week days.
Initial download of the metrics may take a while.