Fig. 3.
Download original image
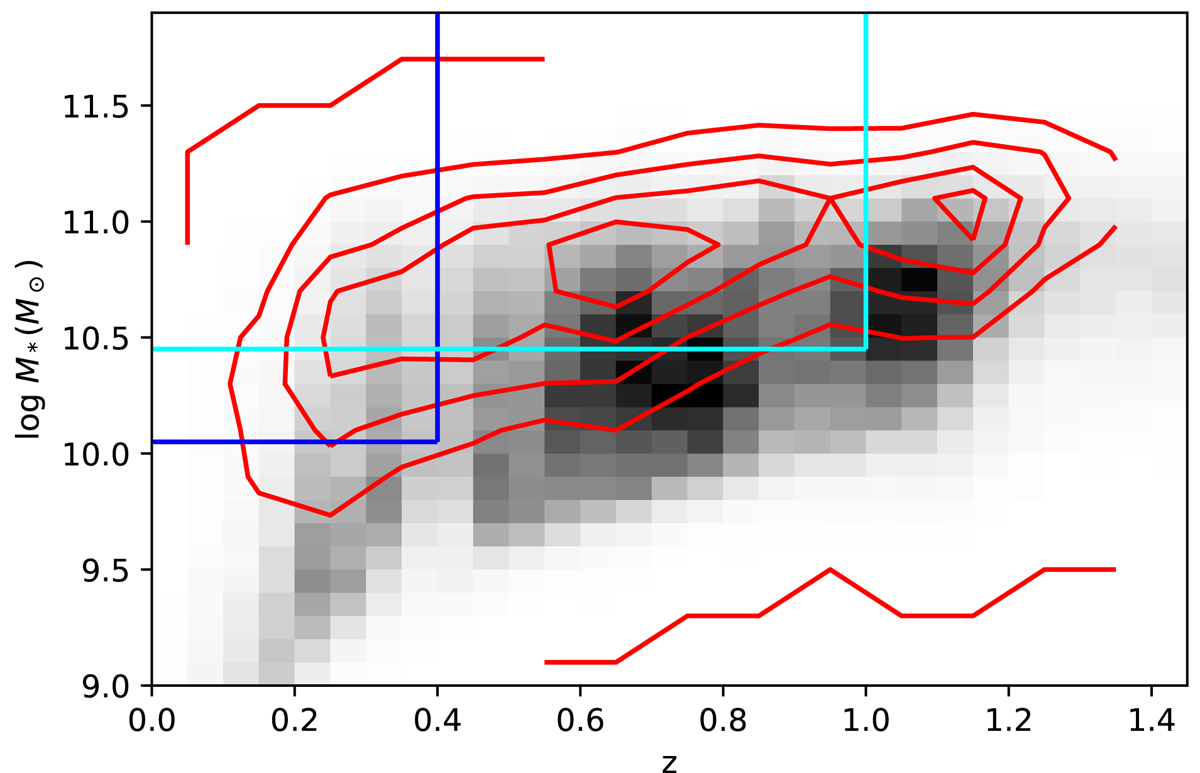
Stellar mass–redshift distribution of the Smith et al. (2021) SED fits. The red contours show the distribution for galaxies with a detection at 150 MHz and the grey histogram shows the distribution for the galaxies without a detection at 150 MHz. The dark blue lines show the region selected for our mass sample and the light blue lines show the region selected for our redshift sample.
Current usage metrics show cumulative count of Article Views (full-text article views including HTML views, PDF and ePub downloads, according to the available data) and Abstracts Views on Vision4Press platform.
Data correspond to usage on the plateform after 2015. The current usage metrics is available 48-96 hours after online publication and is updated daily on week days.
Initial download of the metrics may take a while.