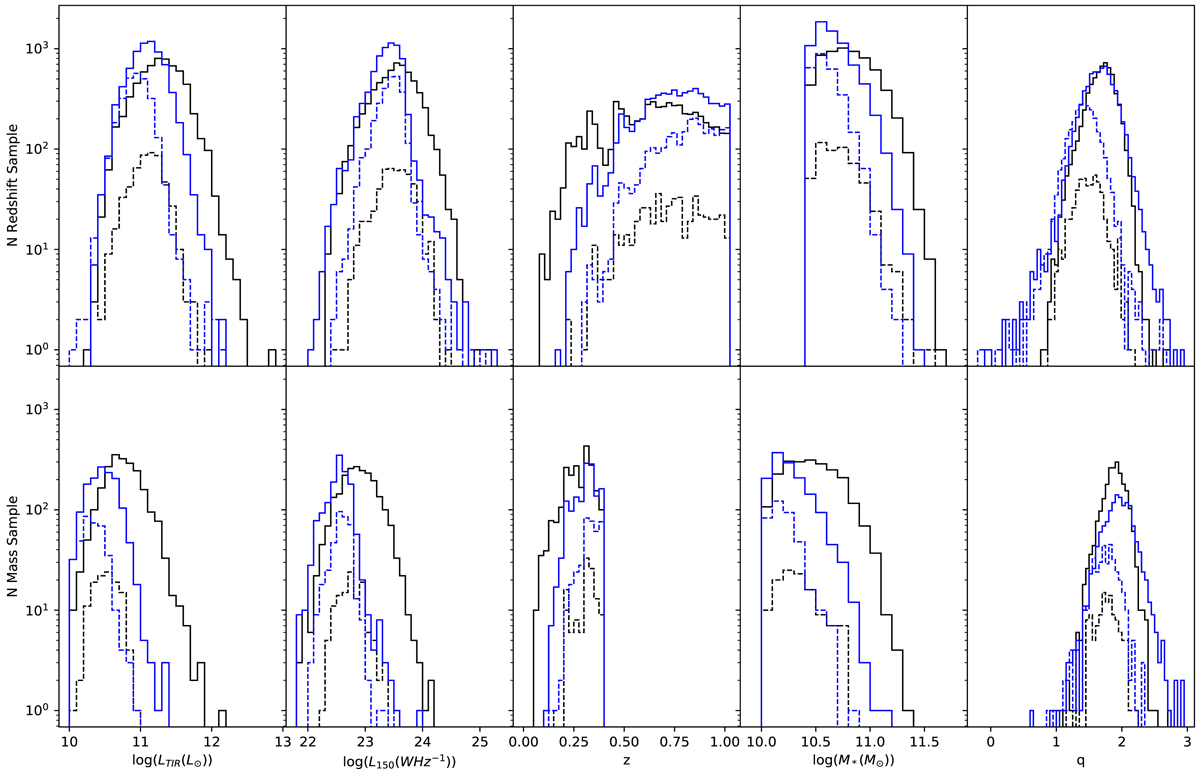
Fig. A.1.
Download original image
How galaxies are distributed, split by their observed fluxes and which sample they are in. The black line shows how the galaxies that are detected at 150 MHz are distributed and the blue line is for galaxies undetected at 150 MHz. If the line is dotted then it shows galaxies that have one unflagged (see section 2.3) flux from PACS or SPIRE and if solid then it has more than one unflagged flux from PACS or SPIRE. We can see that no part of the parameter space is dominated by galaxies that have one or less unflagged flux in PACS or SPIRE.
Current usage metrics show cumulative count of Article Views (full-text article views including HTML views, PDF and ePub downloads, according to the available data) and Abstracts Views on Vision4Press platform.
Data correspond to usage on the plateform after 2015. The current usage metrics is available 48-96 hours after online publication and is updated daily on week days.
Initial download of the metrics may take a while.