Fig. 13.
Download original image
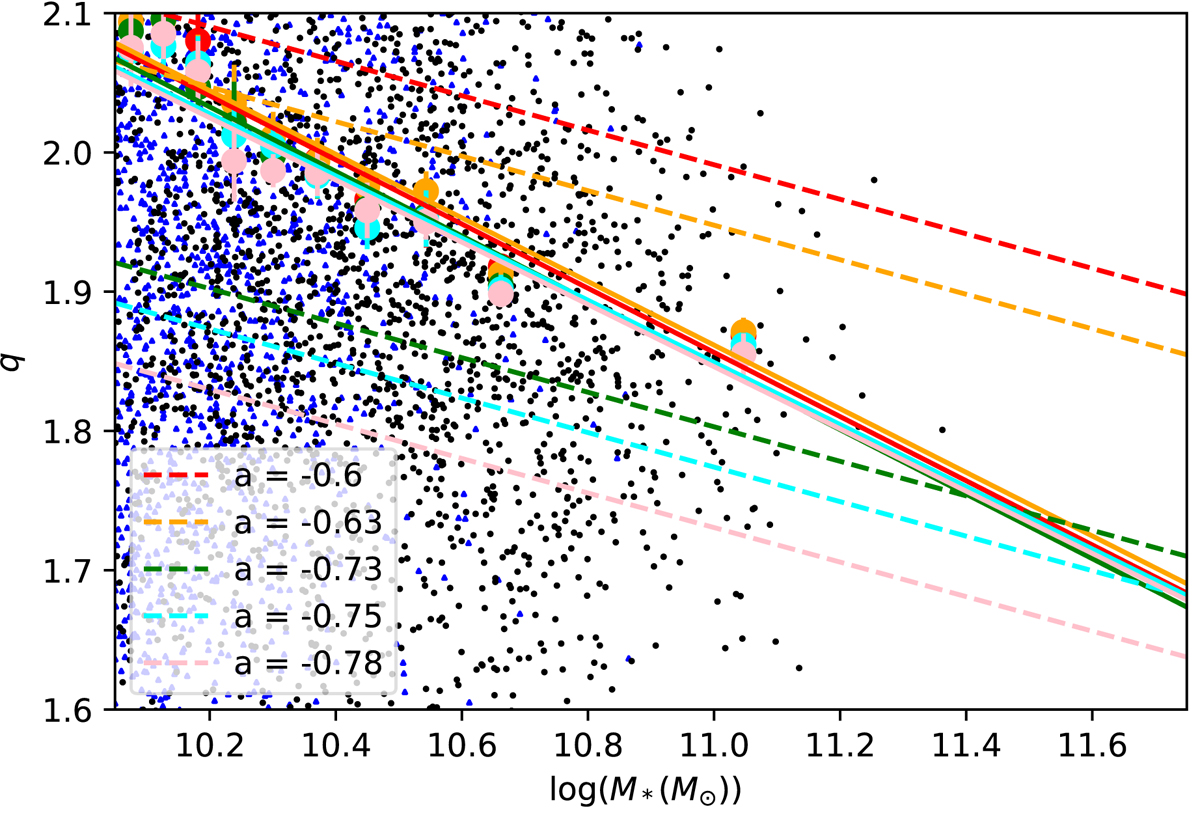
Effect of different spectral indices on the linear fit of the FIRC with stellar mass and how our fits compare to those of Delvecchio et al. (2021). The solid lines show our relation depending on the choice of spectral index (see legend) and the dashed line shows the fit from Delvecchio et al. (2021) when converted to 150 MHz with the same spectral index. The black points show galaxies that are detected at 150 MHz and the blue points show galaxies that have upper limits on there flux at 150 MHz.
Current usage metrics show cumulative count of Article Views (full-text article views including HTML views, PDF and ePub downloads, according to the available data) and Abstracts Views on Vision4Press platform.
Data correspond to usage on the plateform after 2015. The current usage metrics is available 48-96 hours after online publication and is updated daily on week days.
Initial download of the metrics may take a while.