Fig. 11.
Download original image
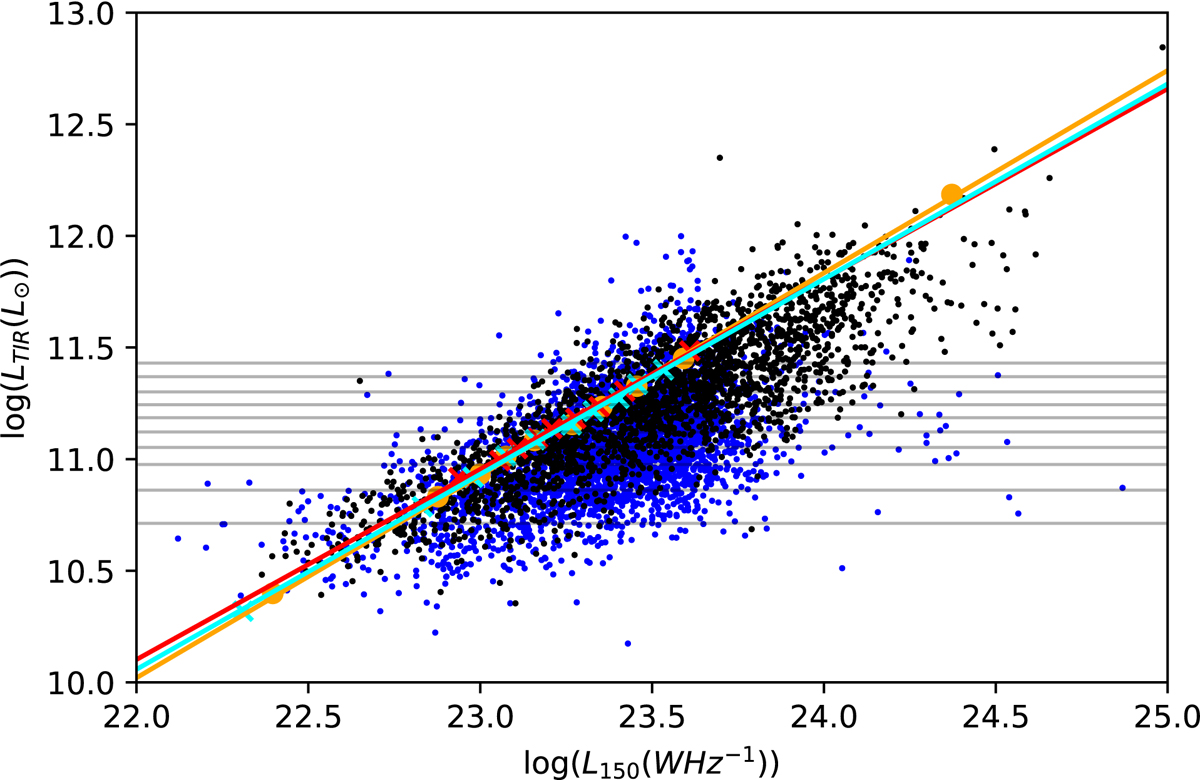
Total-infrared luminosity (8 − 1000 μm) measured using MAGPHYS vs. radio luminosity at 150 MHz for all galaxies. The horizontal lines show the bins that the galaxies were divided into such that each bin contains an equal number of galaxies. The orange points are the median qTIR measured using survival analysis in each LTIR bin and the orange line is the linear fit to those points (we note that the orange points are often behind the cyan and red crosses). Blue data points are upper limits on radio luminosity and black points are direct detections at 150 MHz. The red line is the linear relation we would expect if our galaxies followed the main sequence measured by Schreiber et al. (2015) and the light blue line is that expected if they followed the main sequence measured by Leslie et al. (2020).
Current usage metrics show cumulative count of Article Views (full-text article views including HTML views, PDF and ePub downloads, according to the available data) and Abstracts Views on Vision4Press platform.
Data correspond to usage on the plateform after 2015. The current usage metrics is available 48-96 hours after online publication and is updated daily on week days.
Initial download of the metrics may take a while.