Fig. 10.
Download original image
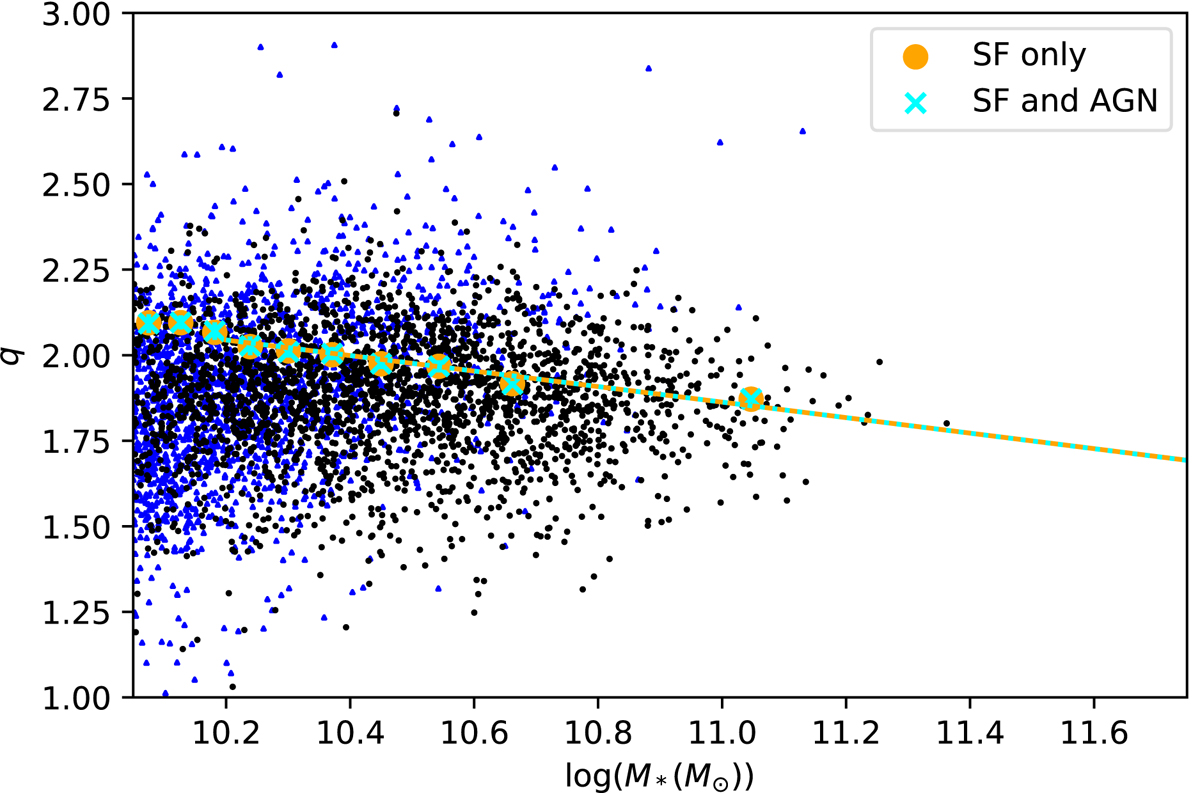
Variation of the FIRC at 150 MHz with stellar mass for our mass sample. The blue points are upper limits of radio luminosity (lower limit on q) and the black points are for direct detections. The orange points are the median qTIR within each stellar mass bin measured using the survival analysis on only SF galaxies, and the orange line is a linear fit to these medians. The light blue crosses and line are the same but when AGN are included in the sample. We note how the blue crosses overlap with the orange points.
Current usage metrics show cumulative count of Article Views (full-text article views including HTML views, PDF and ePub downloads, according to the available data) and Abstracts Views on Vision4Press platform.
Data correspond to usage on the plateform after 2015. The current usage metrics is available 48-96 hours after online publication and is updated daily on week days.
Initial download of the metrics may take a while.