Fig. 1.
Download original image
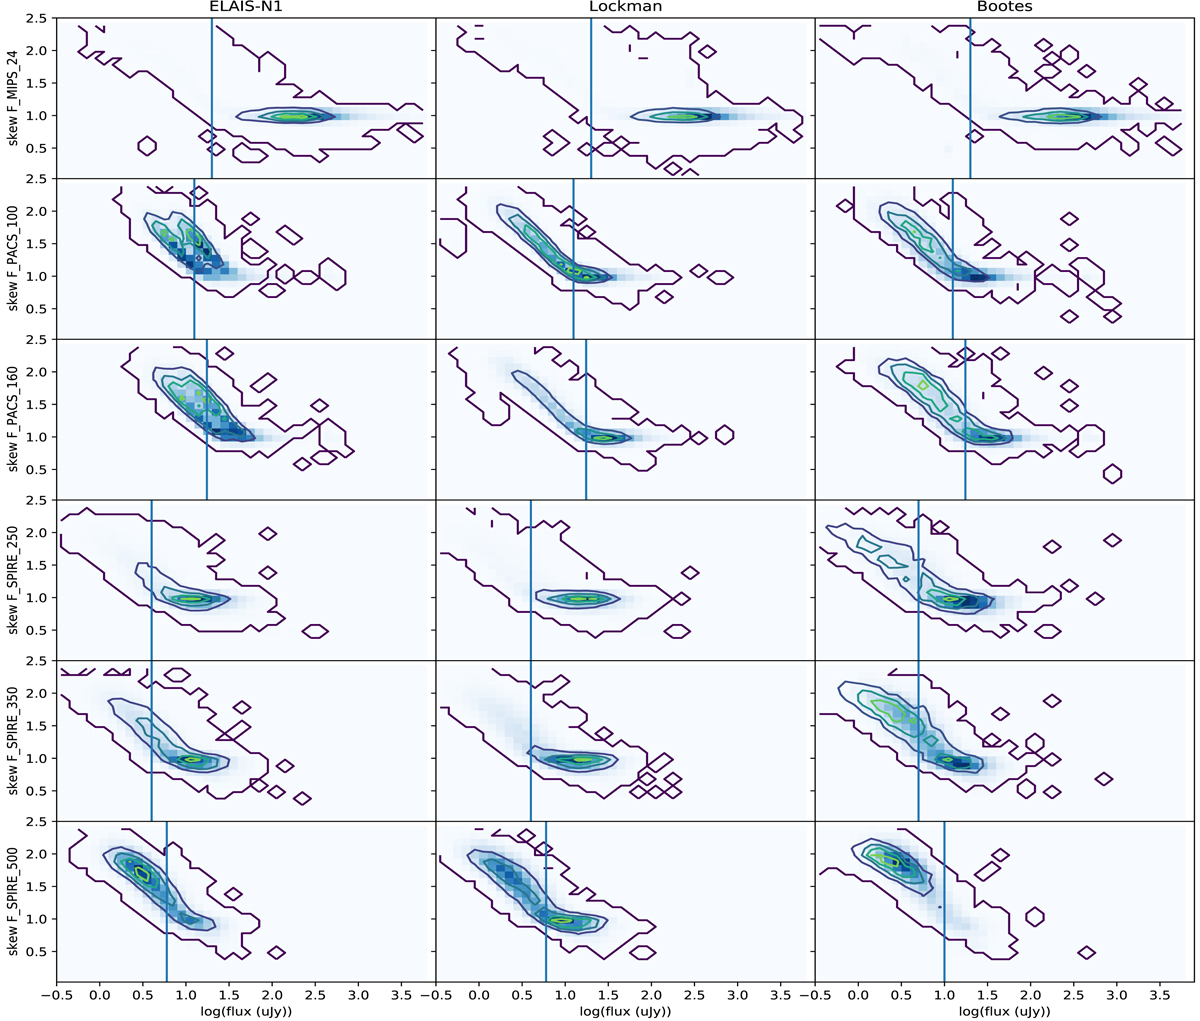
Skew of the XID+ fluxes for all MIPS, PACS, and SPIRE bands in the three LOFAR deep fields. The contours show the density of the LOFAR sources whose multi-wavelength counterpart was originally undetected in the FIR. The histogram beneath the contours shows the distribution of all FIR sources in the LOFAR catalogues. The vertical lines show the flux below which a source’s posterior is dominated by the prior.
Current usage metrics show cumulative count of Article Views (full-text article views including HTML views, PDF and ePub downloads, according to the available data) and Abstracts Views on Vision4Press platform.
Data correspond to usage on the plateform after 2015. The current usage metrics is available 48-96 hours after online publication and is updated daily on week days.
Initial download of the metrics may take a while.