Fig. 5
Download original image
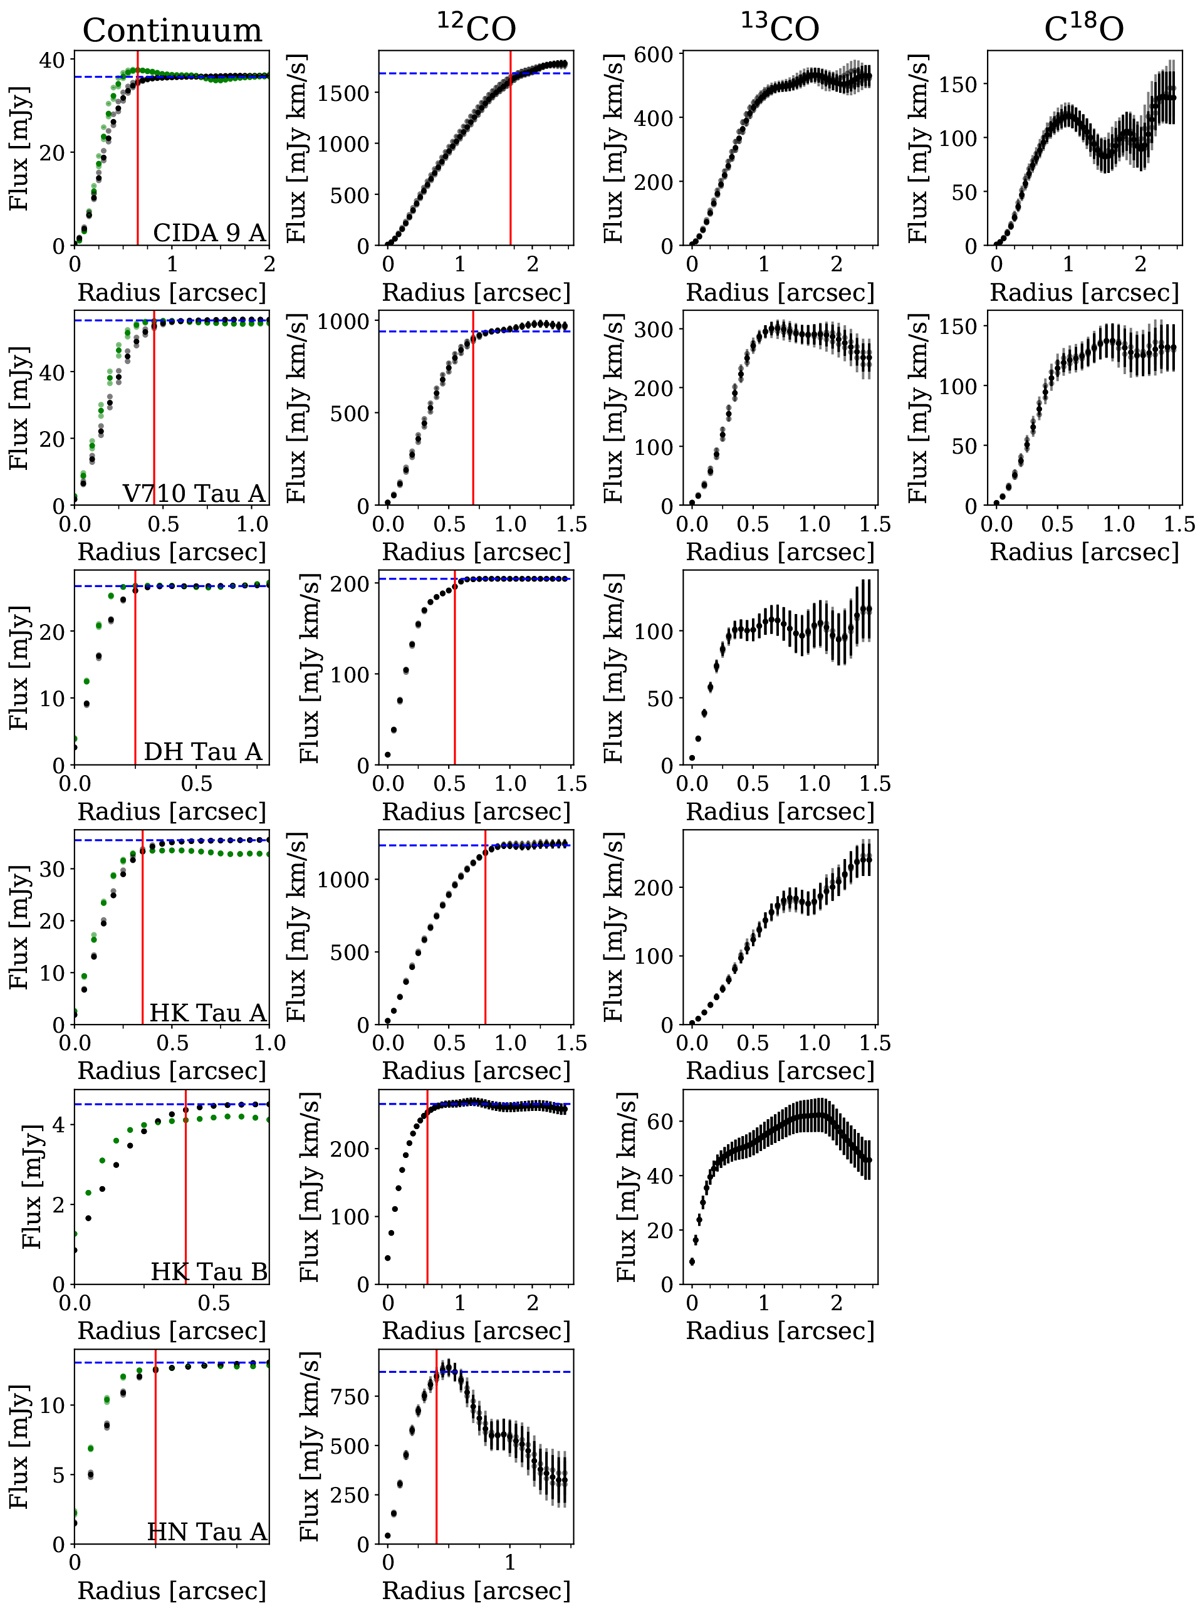
Cumulative fluxes as a function of aperture radius estimated using the cumulative flux technique. Each panel shows the fluxes for a different data set or image (the name of the target for each row is shown in the lower right corner of the first column). First column: continuum emission of the data from Manara et al. (2019) (green dots) and the continuum emission from the new data (black dots). Second, third, and fourth columns: the 12CO, 13CO, and C18O moment zero emission from the new data, respectively. The blue dashed lines show the estimated disc total fluxes; the red solid lines show the disc radii, which are defined as the radii containing 95% of the total flux (see values reported in Tables 6 and 7). In the first column, only the total fluxes and disc radii estimated from the new continuum data are shown.
Current usage metrics show cumulative count of Article Views (full-text article views including HTML views, PDF and ePub downloads, according to the available data) and Abstracts Views on Vision4Press platform.
Data correspond to usage on the plateform after 2015. The current usage metrics is available 48-96 hours after online publication and is updated daily on week days.
Initial download of the metrics may take a while.