Fig. 3
Download original image
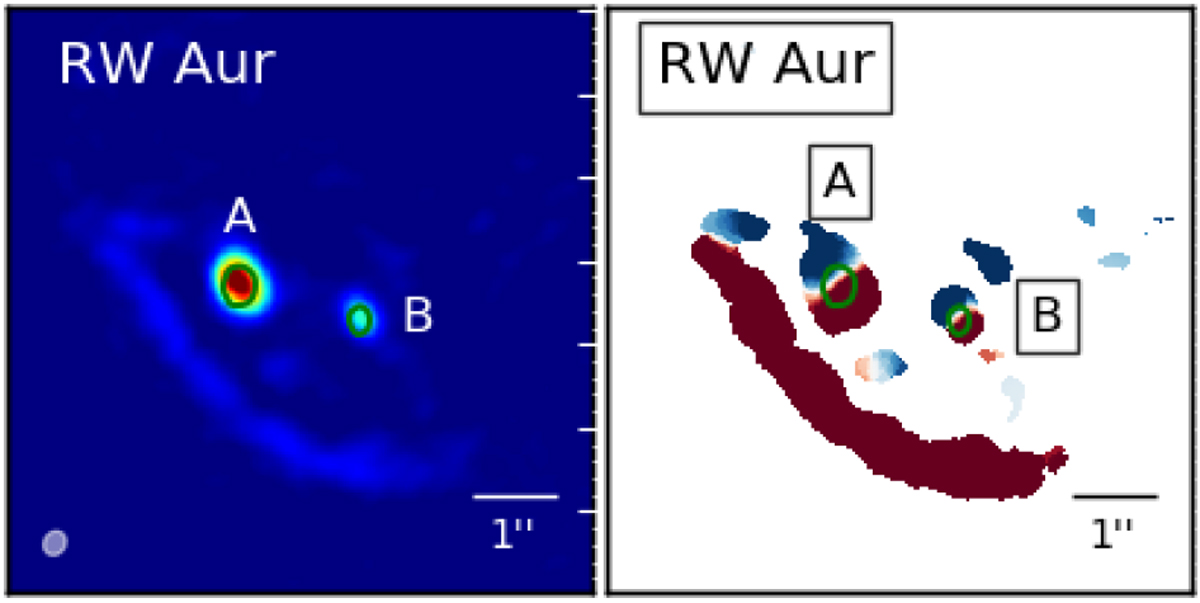
Maps of the RW Aur system observed by Rodriguez et al. (2018). Left: 12CO zeroth moment. The colour scale has the peak flux as the maximum, and two times the image rms as minimum. Right: 12CO first velocity maps created with bettermoments quadratic method (Teague & Foreman-Mackey 2018) and with a 4-sigma clipping process. The image scaled so that the maximum and the minimum are equal to the systemic velocity of the primary target ±2 km s−1.
Current usage metrics show cumulative count of Article Views (full-text article views including HTML views, PDF and ePub downloads, according to the available data) and Abstracts Views on Vision4Press platform.
Data correspond to usage on the plateform after 2015. The current usage metrics is available 48-96 hours after online publication and is updated daily on week days.
Initial download of the metrics may take a while.