Fig. B.1
Download original image
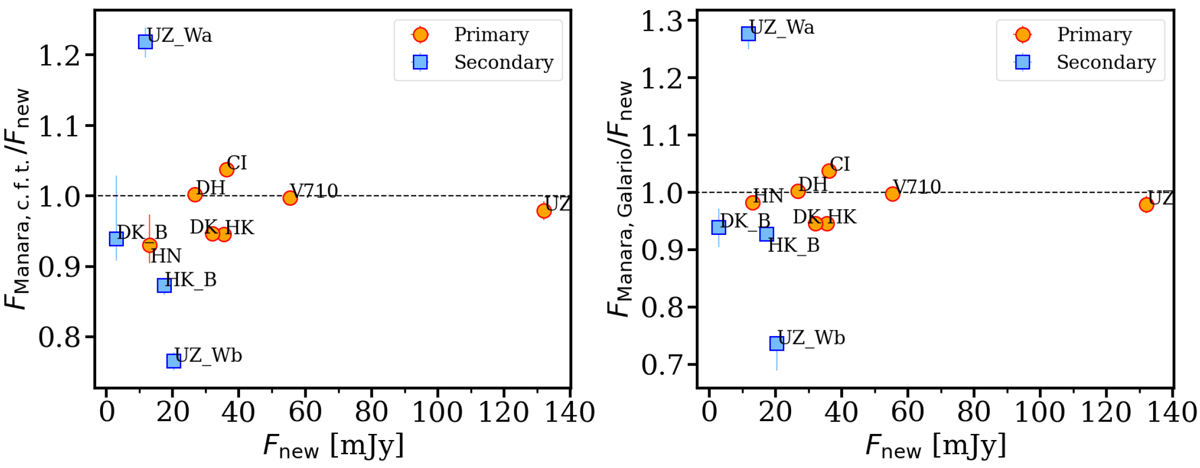
Comparisons between the total disc fluxes measured from the new continuum observation with that measured from the data presented by Manara et al. (2019). The left panel shows the ratio between the total fluxes calculated using the data by Manara et al. (2019) (FManara,c.f.t.) and using the new continuum data (Fnew), both estimated through the cumulative flux technique. The right-hand panel instead reports the ratio using the fluxes calculated by Manara et al. (2019) with the uv-modelling method (FManara,Galario), and using the new continuum data with the cumulative flux technique. Red circles are used for circumprimary discs, blue squares for circumsecondary ones.
Current usage metrics show cumulative count of Article Views (full-text article views including HTML views, PDF and ePub downloads, according to the available data) and Abstracts Views on Vision4Press platform.
Data correspond to usage on the plateform after 2015. The current usage metrics is available 48-96 hours after online publication and is updated daily on week days.
Initial download of the metrics may take a while.