Fig. A.1
Download original image
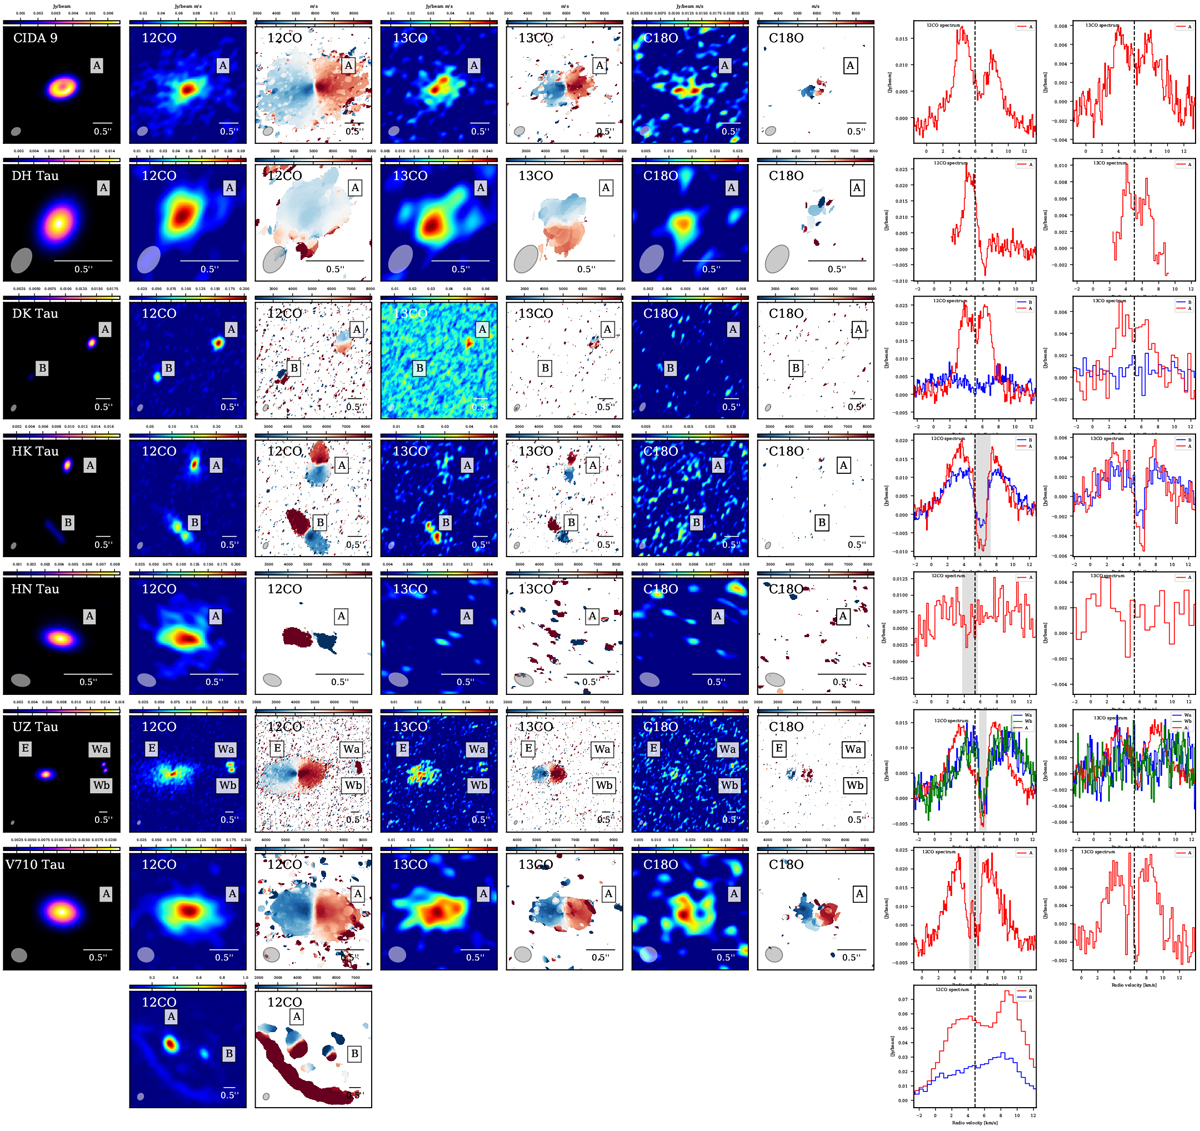
Images and spectra of all targets in the analysed sample. Each row refers to a system in the sample. The first columns show the continuum images with the names of the targets indicated in the top left. The second, fourth, and sixth columns show the zeroth moment images for the 12CO, the 13CO, and the C18O emission, respectively, scaled so that the maximum is equal to the peak flux and the minimum is clipped at the image rms. The third, fifth, and seventh columns show the first moment images (calculated through the bettermoments tool) for the 12CO, 13CO, and C18O emission, respectively, scaled so that the maximum and the minimum are equal to the systemic velocity of the target ±2 km/s. The FWHM beam size is shown in the bottom left of each panel. All bars in the bottom right of each panel are 0.″5 long. The last two columns show the 12CO and 13CO spectra of the circumprimary (red), circumsecondary (blue), and circumtertiary (green) discs (when applicable), with vertical black lines showing the systemic velocities fitted with the eddy tool and grey band showing the excluded absorbed velocities in eddy fitting on circumprimary disc rotation maps (see Table 4).
Current usage metrics show cumulative count of Article Views (full-text article views including HTML views, PDF and ePub downloads, according to the available data) and Abstracts Views on Vision4Press platform.
Data correspond to usage on the plateform after 2015. The current usage metrics is available 48-96 hours after online publication and is updated daily on week days.
Initial download of the metrics may take a while.