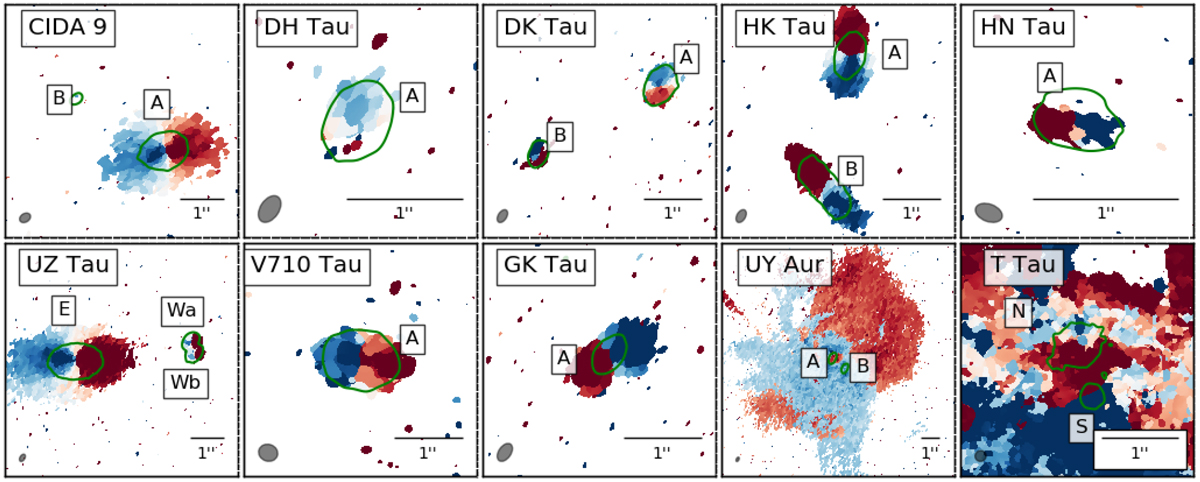
Fig. 2
Download original image
12CO velocity map images of the discs created with the bettermoments quadratic method (Teague & Foreman-Mackey 2018). A 4-sigma clipping process was applied to all images. The FWHM beam size is shown in the bottom left of each panel. Each image is scaled so that the maximum and the minimum are equal to the systemic velocity of the primary target ±2 km s−1. Green contours show five times the rms of the continuum emission. The components of the systems are labelled. The label for any undetected secondary components in the continuum emission is not shown.
Current usage metrics show cumulative count of Article Views (full-text article views including HTML views, PDF and ePub downloads, according to the available data) and Abstracts Views on Vision4Press platform.
Data correspond to usage on the plateform after 2015. The current usage metrics is available 48-96 hours after online publication and is updated daily on week days.
Initial download of the metrics may take a while.