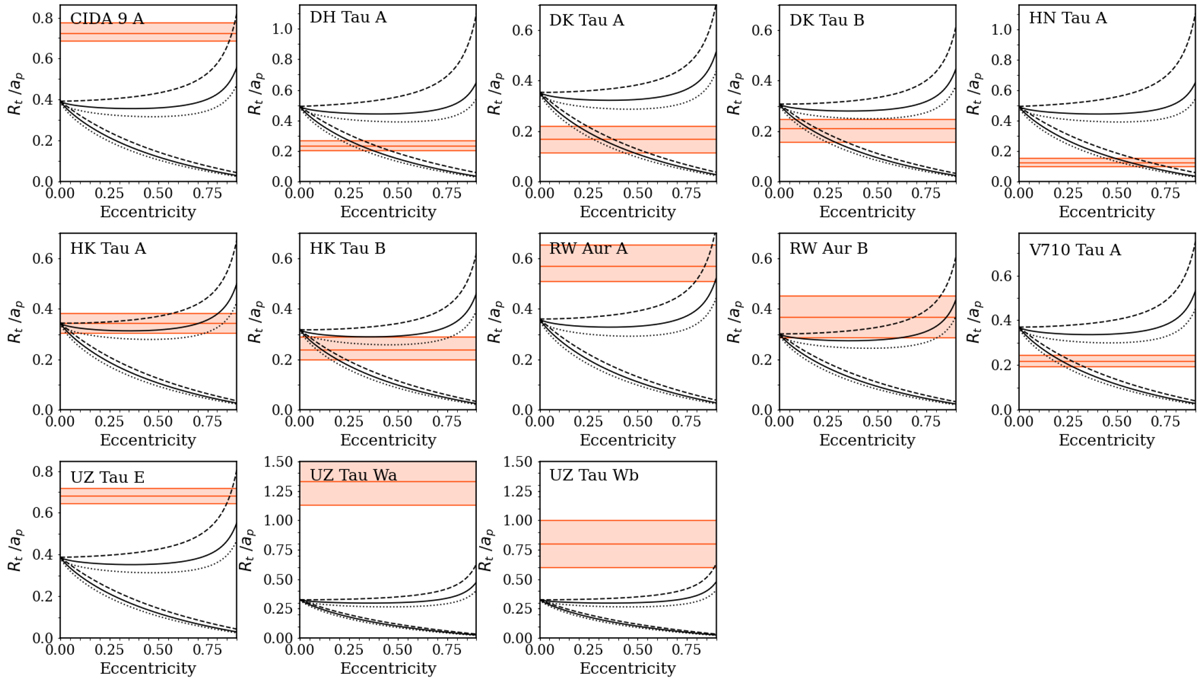
Fig. 14
Download original image
Condition on the eccentricity of the stellar orbits for which the estimated truncation radii of the discs in the sample are in agreement with theoretical predictions (see Sect. 5.2). Red bands show the estimated R95,gas/ap with their uncertainties. Black curves show the expected truncation radius in units of the projected separation for different Reynolds numbers: dashed curves for ℛ = 104, solid for ℛ = 105, and dotted for ℛ = 106. The lower black curves are obtained assuming that the secondary is observed at apoastron, while black curves at the top assuming that the secondary is located at periastron. The expected Rt/ap increases for higher orbital inclination, and thus the black curves would move to higher values in the plot if the assumption of face-on orbits is not fulfilled (see Eq. (2)).
Current usage metrics show cumulative count of Article Views (full-text article views including HTML views, PDF and ePub downloads, according to the available data) and Abstracts Views on Vision4Press platform.
Data correspond to usage on the plateform after 2015. The current usage metrics is available 48-96 hours after online publication and is updated daily on week days.
Initial download of the metrics may take a while.