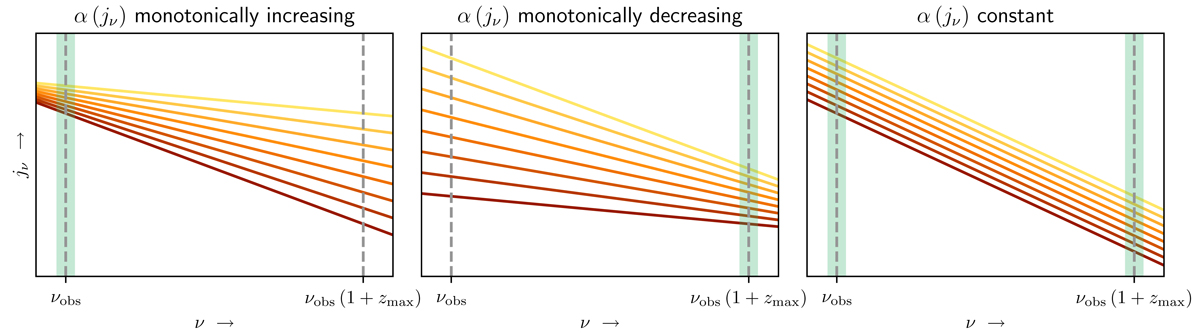
Fig. A.4.
Download original image
Three scenarios for simple power-law synchrotron spectra of shocks that are consistent with our methodology. Due to cosmological redshifting, the calculation of the specific intensity Iν at observing frequency νobs necessitates knowing the monochromatic emission coefficient (MEC) jν at a range of emission frequencies ν (see Eq. 8). In this work, we generate jν at emission frequencies ν = νobs and ν = νobs(1+zmax), where zmax is the maximum cosmological redshift of the large-scale structure reconstructions. We do so using the same Gaussian random field realisation 𝒵 (and thus percentile random field realisation 𝒫), implicitly assuming that shocks retain their MEC percentile rank over the frequency range [νobs, νobs(1+zmax)]. This assumption holds in the three scenarios sketched above. Each solid line represents a shock with constant percentile rank (over the range shown, at least); the graphs are drawn with logarithmic scaling. Regarding the sign of the spectral index, we use the convention jν ∝ να. Left: the integrated spectral index α is a monotonically increasing function of jν at ν = νobs (‘brighter shocks have flatter spectra’). Middle: the integrated spectral index α is a monotonically decreasing function of jν at ν = νobs(1+zmax) (‘brighter shocks have steeper spectra’). Right: the integrated spectral index α is a jν-independent constant (at all frequencies); this is a limiting case of the previous two.
Current usage metrics show cumulative count of Article Views (full-text article views including HTML views, PDF and ePub downloads, according to the available data) and Abstracts Views on Vision4Press platform.
Data correspond to usage on the plateform after 2015. The current usage metrics is available 48-96 hours after online publication and is updated daily on week days.
Initial download of the metrics may take a while.