Fig. 13.
Download original image
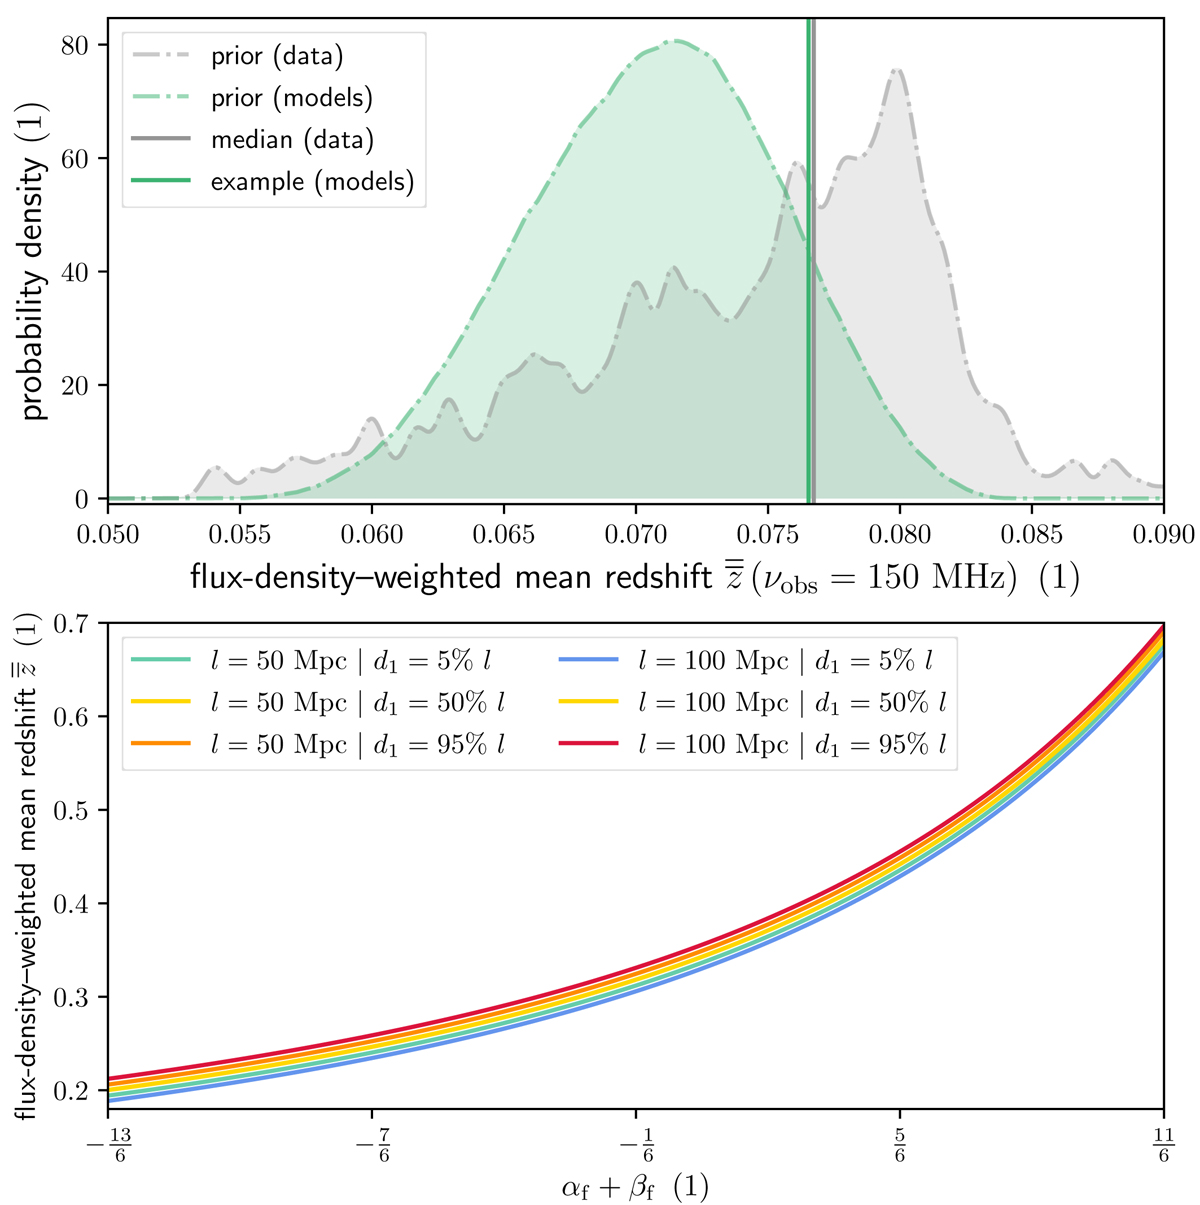
MASSCW flux-density–weighted mean redshift ![]() results. Top: distribution of
results. Top: distribution of ![]() calculated via KDE from our prior’s 103 realisations of Iν and
calculated via KDE from our prior’s 103 realisations of Iν and ![]() (shaded grey), which are limited to zmax = 0.2. The median is
(shaded grey), which are limited to zmax = 0.2. The median is ![]() (solid grey). Furthermore, we show the variety of geometric model predictions for
(solid grey). Furthermore, we show the variety of geometric model predictions for ![]() when similarly limited to zmax = 0.2, assuming flat priors on all model parameters (shaded green; see text for details). The median is
when similarly limited to zmax = 0.2, assuming flat priors on all model parameters (shaded green; see text for details). The median is ![]() . As a concrete example, we show the flux-density–weighted mean redshift of a single model that reproduces the data median (solid green). This model is given by l = 75 Mpc, d1 = 60 Mpc and βc = −4/3. Bottom: predictions for
. As a concrete example, we show the flux-density–weighted mean redshift of a single model that reproduces the data median (solid green). This model is given by l = 75 Mpc, d1 = 60 Mpc and βc = −4/3. Bottom: predictions for ![]() considering filaments only, varying all three relevant geometric model parameters: αf + βf, l and d1. The two d1 = 50% l curves are virtually indistinguishable.
considering filaments only, varying all three relevant geometric model parameters: αf + βf, l and d1. The two d1 = 50% l curves are virtually indistinguishable.
Current usage metrics show cumulative count of Article Views (full-text article views including HTML views, PDF and ePub downloads, according to the available data) and Abstracts Views on Vision4Press platform.
Data correspond to usage on the plateform after 2015. The current usage metrics is available 48-96 hours after online publication and is updated daily on week days.
Initial download of the metrics may take a while.