Fig. 12.
Download original image
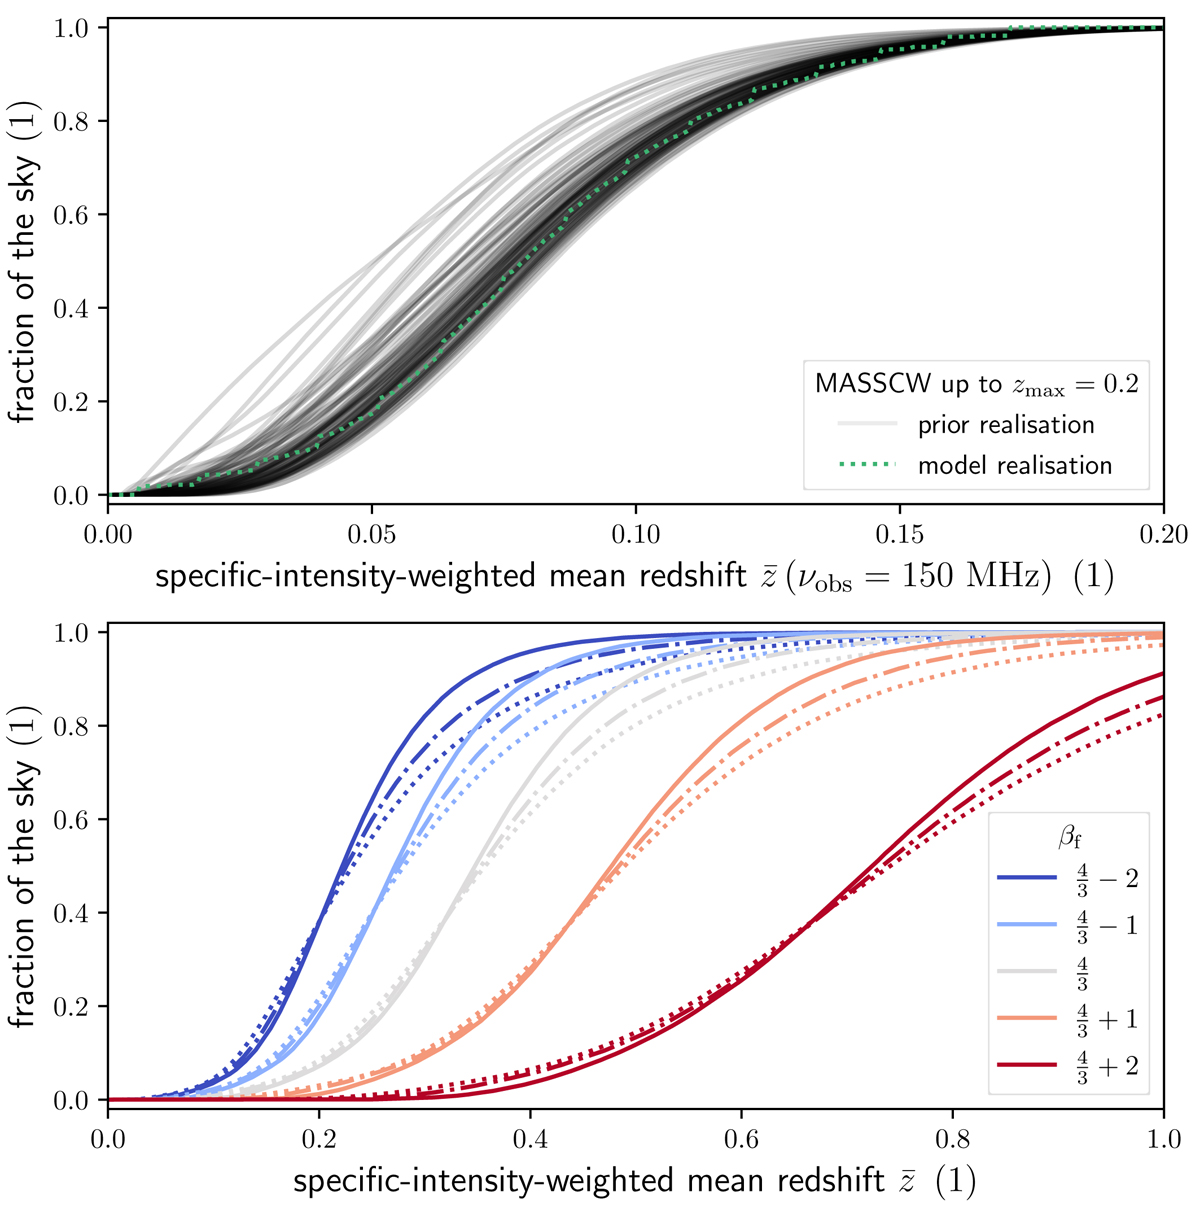
MASSCW specific-intensity–weighted mean redshift RV ![]() results. Top: distributions of
results. Top: distributions of ![]() , showing 100 randomly selected ECDFs from our prior (grey curves), and a geometric model CDF (green curve). Both data and model consider LSS up to redshift zmax = 0.2 only. The other geometric model parameters are: wf = 5 Mpc, l = 50 Mpc, d1 = 25 Mpc, 𝒞 = 106, αf = αc = −3/2, βf = 4/3 and βc = −4/3. Bottom: geometric model CDFs of
, showing 100 randomly selected ECDFs from our prior (grey curves), and a geometric model CDF (green curve). Both data and model consider LSS up to redshift zmax = 0.2 only. The other geometric model parameters are: wf = 5 Mpc, l = 50 Mpc, d1 = 25 Mpc, 𝒞 = 106, αf = αc = −3/2, βf = 4/3 and βc = −4/3. Bottom: geometric model CDFs of ![]() for filaments only (𝒞 = 0), though including all of them (zmax = ∞). By far the most influential parameter is also the most uncertain one; we therefore vary βf over a plausible range. We also vary l ∈ {50 Mpc, 75 Mpc, 100 Mpc}, and by extension also wf and d1, by forcing
for filaments only (𝒞 = 0), though including all of them (zmax = ∞). By far the most influential parameter is also the most uncertain one; we therefore vary βf over a plausible range. We also vary l ∈ {50 Mpc, 75 Mpc, 100 Mpc}, and by extension also wf and d1, by forcing ![]() and
and ![]() . As l increases, the unit cell number density decreases; we symbolise this with more sparsely drawn curves. We keep αf = −3/2 constant.
. As l increases, the unit cell number density decreases; we symbolise this with more sparsely drawn curves. We keep αf = −3/2 constant.
Current usage metrics show cumulative count of Article Views (full-text article views including HTML views, PDF and ePub downloads, according to the available data) and Abstracts Views on Vision4Press platform.
Data correspond to usage on the plateform after 2015. The current usage metrics is available 48-96 hours after online publication and is updated daily on week days.
Initial download of the metrics may take a while.