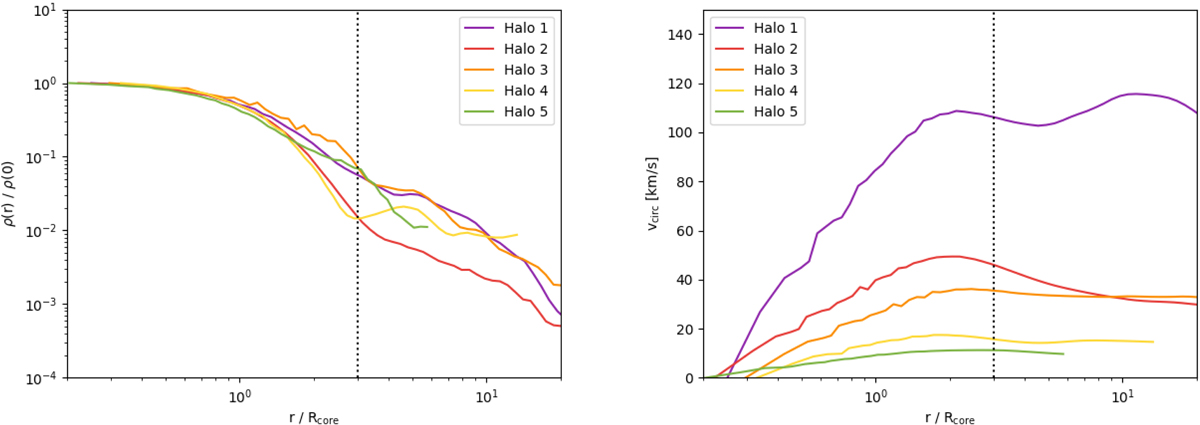
Fig. 5.
Download original image
Dark matter density profiles (left panel) and rotation curves (right panel) of a representative sample of five FDM haloes found at redshift z = 2.5. The density of each individual halo is expressed in units of its central density. Similarly, the radial distance is normalised to the core radius of each individual halo. In both panels, the vertical dashed line corresponds to r = 3 Rcore, marking the point where the solitonic profile breaks. The masses of the haloes shown in this figure are M1 = 6.52 × 10⁹ M⊙, M2 = 1.55 × 10⁹ M⊙, M3 = 2.25 × 10⁹ M⊙, M4 = 2.30 × 10⁸ M⊙, and M5 = 8.46 × 10⁷ M⊙.
Current usage metrics show cumulative count of Article Views (full-text article views including HTML views, PDF and ePub downloads, according to the available data) and Abstracts Views on Vision4Press platform.
Data correspond to usage on the plateform after 2015. The current usage metrics is available 48-96 hours after online publication and is updated daily on week days.
Initial download of the metrics may take a while.