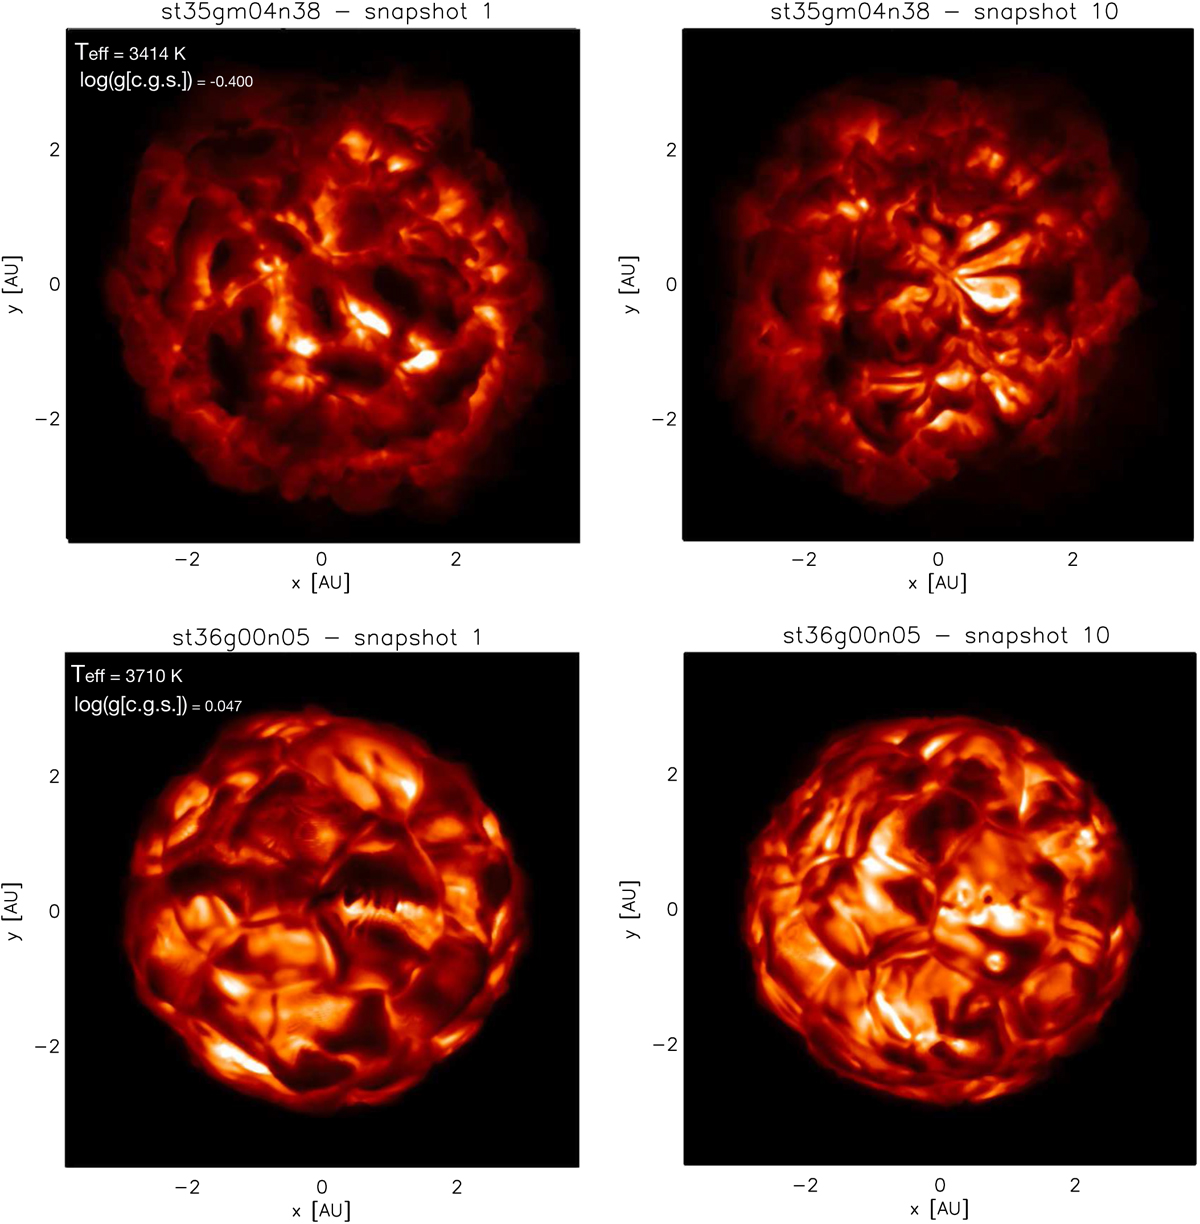
Fig. 2.

Download original image
Example of intensity maps in Gaia G photometric system for two RHD simulations in Table 1 and for two different snapshots about 200 days apart. The range is [0.−825942] erg s−1 cm−2 Å−1 for low Teff and log g simulation st35gm04n38 (top panel) and [0.−299977] erg s−1 cm−2 Å−1 for the highest Teff and log g simulation st36gm00n05 (bottom panel). The intensity is shown on a square-root scale to make the structures more visible.
Current usage metrics show cumulative count of Article Views (full-text article views including HTML views, PDF and ePub downloads, according to the available data) and Abstracts Views on Vision4Press platform.
Data correspond to usage on the plateform after 2015. The current usage metrics is available 48-96 hours after online publication and is updated daily on week days.
Initial download of the metrics may take a while.


