Free Access
Fig. 6.
Download original image
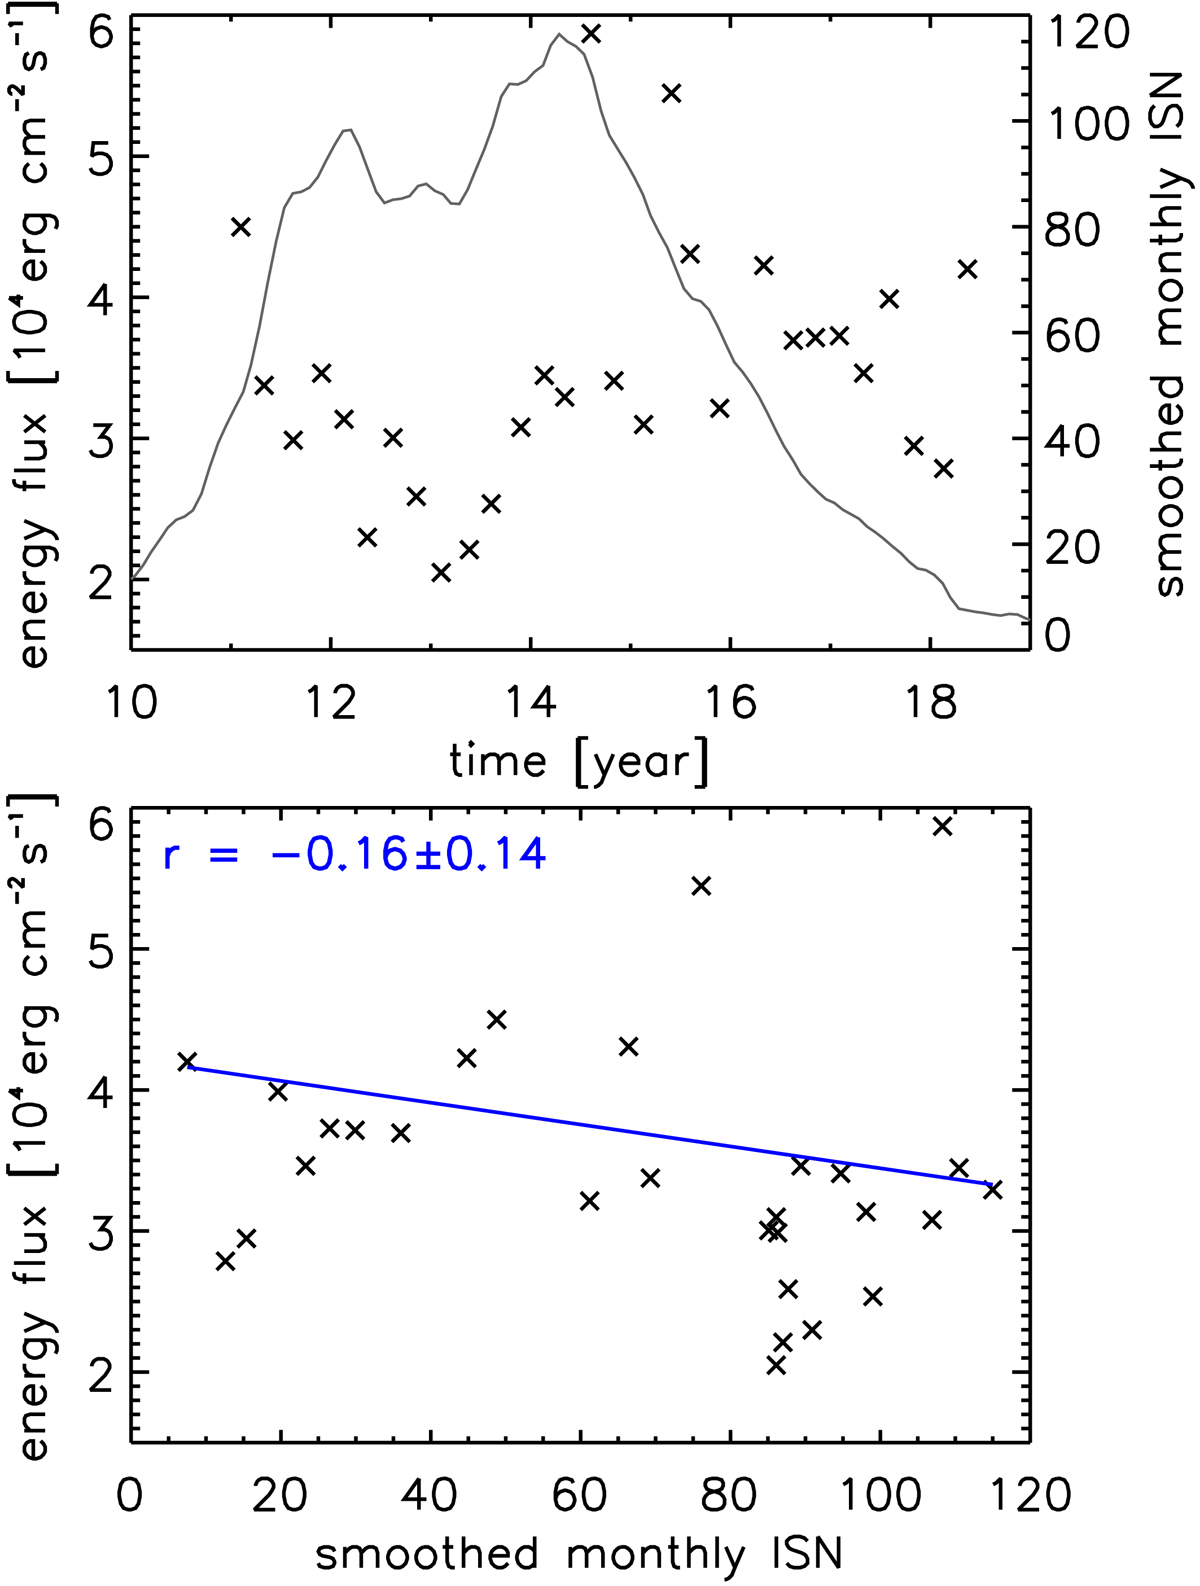
Top: mean energy flux from nanoflares as a function of time along with the ISN. Bottom: scatter plot of mean energy flux against ISN. A linear function (blue) in log-log space was fitted to the data yielding the indicated Pearson correlation coefficient r.
Current usage metrics show cumulative count of Article Views (full-text article views including HTML views, PDF and ePub downloads, according to the available data) and Abstracts Views on Vision4Press platform.
Data correspond to usage on the plateform after 2015. The current usage metrics is available 48-96 hours after online publication and is updated daily on week days.
Initial download of the metrics may take a while.