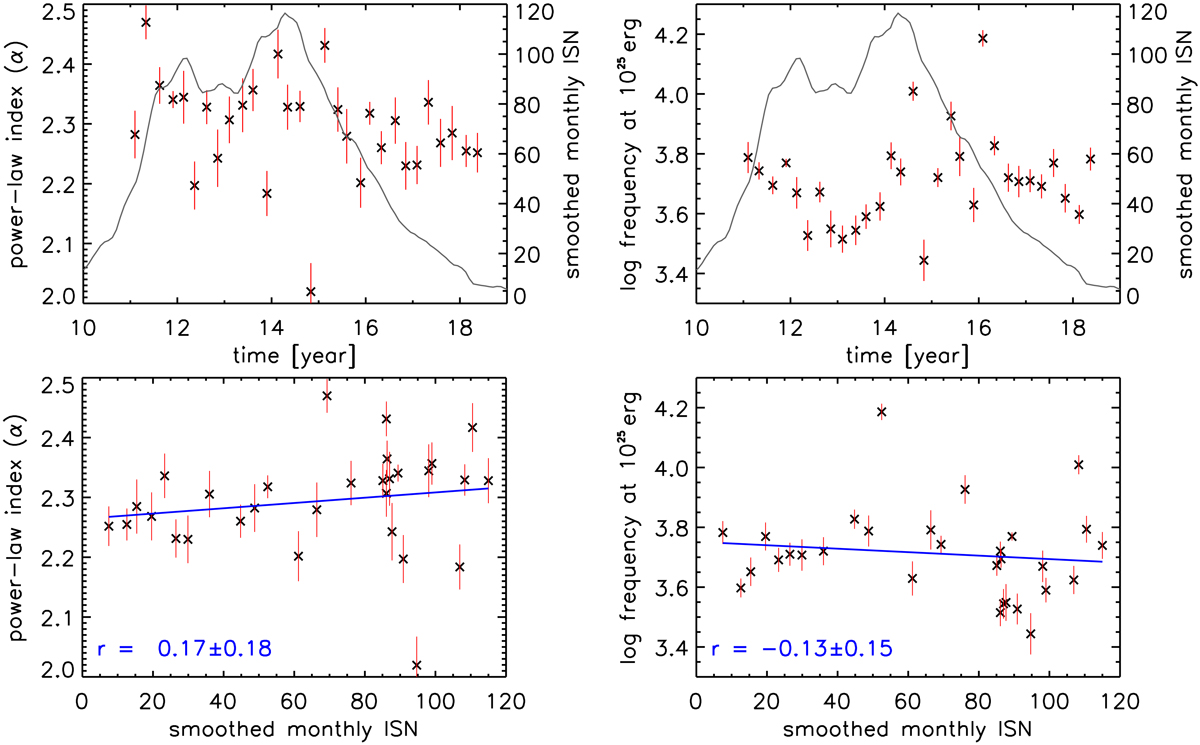
Fig. 3.
Download original image
Fitting parameters of the nanoflare frequency distributions as a function of time and correlated to the ISN. Top: power-law index α (left) and frequency at 1025 erg (right) as a function of time along with the 13-month smoothed monthly mean ISN. The fitting error for both parameters is shown as red vertical lines. Bottom: scatter plots of both fitting parameters against ISN. A linear function (blue) was fitted to the data, yielding the indicated Pearson correlation coefficient r together with the uncertainty range.
Current usage metrics show cumulative count of Article Views (full-text article views including HTML views, PDF and ePub downloads, according to the available data) and Abstracts Views on Vision4Press platform.
Data correspond to usage on the plateform after 2015. The current usage metrics is available 48-96 hours after online publication and is updated daily on week days.
Initial download of the metrics may take a while.