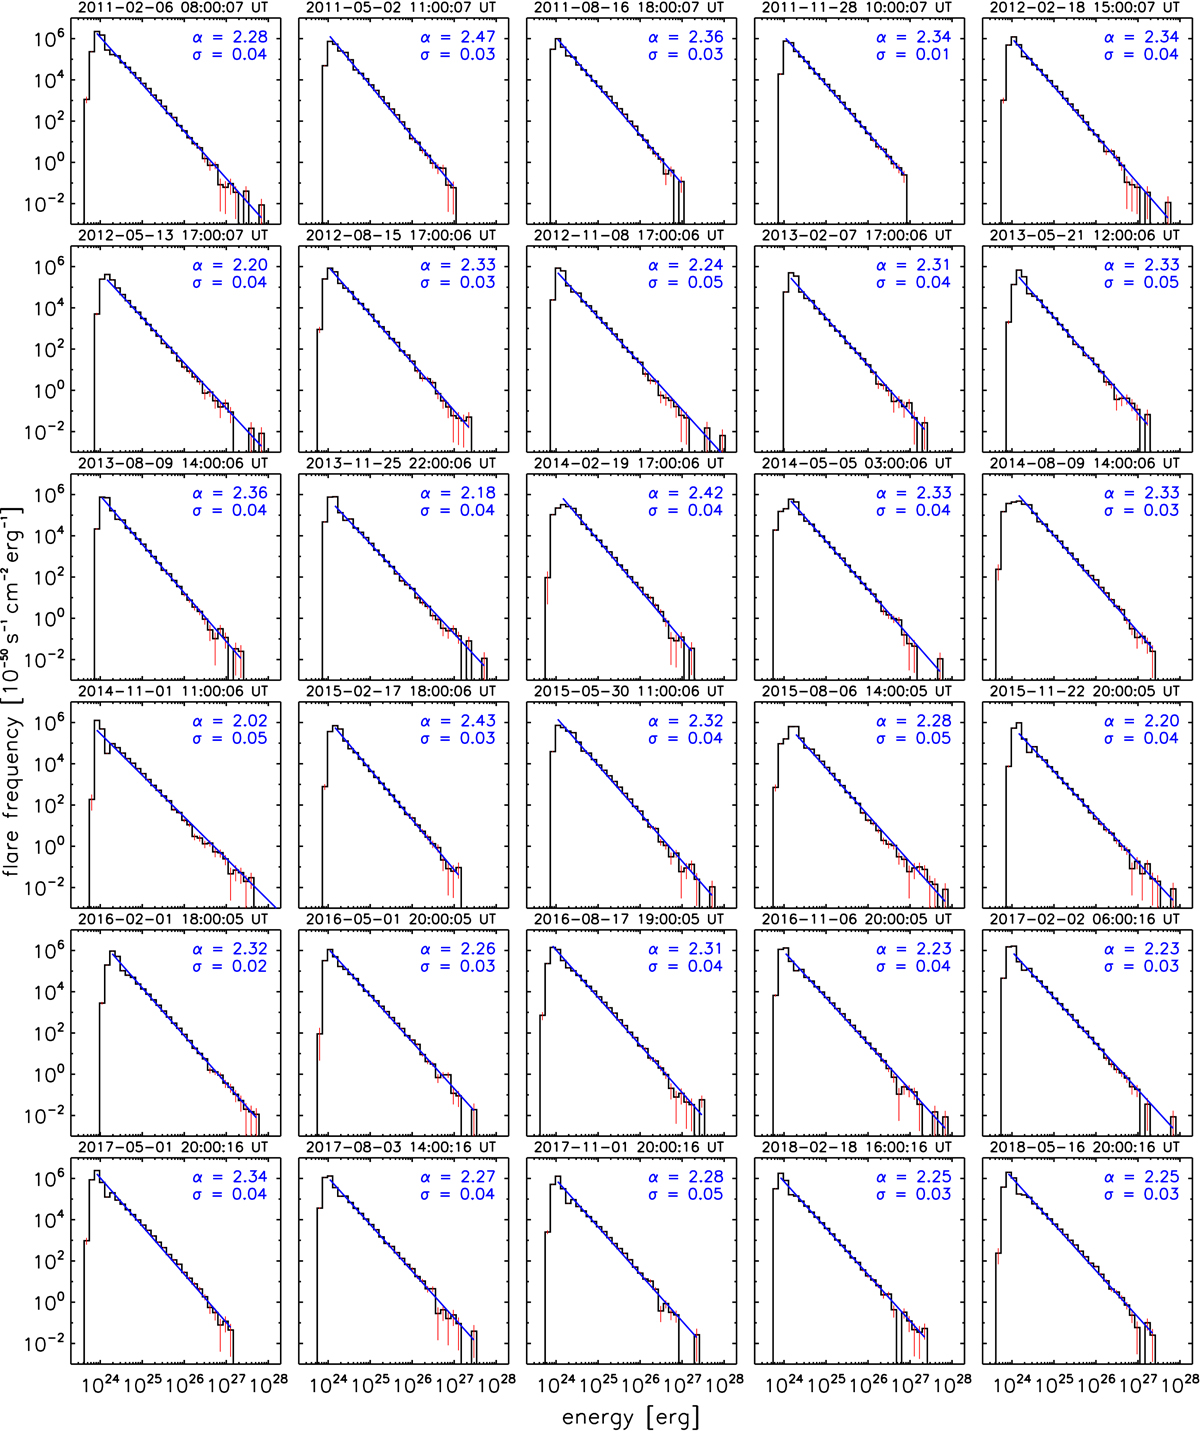
Fig. 2.
Download original image
Nanoflare frequency distribution for each data set over the years 2011–2018 during solar cycle 24. The start date and time of the corresponding data set are given on the top. Events were extracted with the detection interval set to D = 2, a threshold factor of F = 5, and a combination interval of C = 5. A linear fit (blue) without the use of the weights derived from the counting errors (red) was used to extract the power-law index (α) and its fitting error (σ).
Current usage metrics show cumulative count of Article Views (full-text article views including HTML views, PDF and ePub downloads, according to the available data) and Abstracts Views on Vision4Press platform.
Data correspond to usage on the plateform after 2015. The current usage metrics is available 48-96 hours after online publication and is updated daily on week days.
Initial download of the metrics may take a while.